Practitioners Academy Academy (opens in a new tab) Book a Consultation
HomeSolutionsUtility & Energy Monitoring Signals
Solution blueprint

Utility & Energy Monitoring Signals

A blueprint for connecting power, compressed air, steam, water, and utility signals to production context, review cadence, and operating action.

Operating problem

Utility and energy data often arrives as a bill, meter export, or dashboard after the operating decision has passed. The blueprint focuses on connecting utility signals to production context and action ownership.

How to read this blueprint Cost-exposure figures in this blueprint are planning models, not benchmarks. Calculate savings potential from your own documented plant assumptions — metered baselines, tariff structure, and load profile — before committing to a programme.
Utility and Energy Monitoring Signals blueprint video poster
01:00 visual explainer brief: Show how utility signals become useful when connected to production state, asset condition, review cadence, and action thresholds.
Symptoms and decision signals

What usually tells the team the problem is real

Utility peaks without context

Energy or utility spikes are visible, but not connected to production state, machine state, or maintenance condition.
Reports without owner

Monthly consumption reports exist, but no one owns the review cadence or action threshold.

Compressed air or utility drift

Leaks, compressor cycling, steam loss, or water use grows slowly and becomes normal.

Asset condition is missing

A utility asset draws more energy because condition, duty, or control behavior is degrading.
Why common approaches fail

Useful technology fails when the operating decision is undefined

Meter-only rollout More meters are installed without production context, action rules, or review ownership.
Cost report without decision path The report shows usage after the fact but does not create a same-week operating or maintenance decision.
No baseline by state Normal consumption is not separated by production, idle, cleaning, startup, or utility mode.
Disconnected maintenance evidence Utility usage is reviewed separately from compressor, motor, pump, fan, or valve condition.
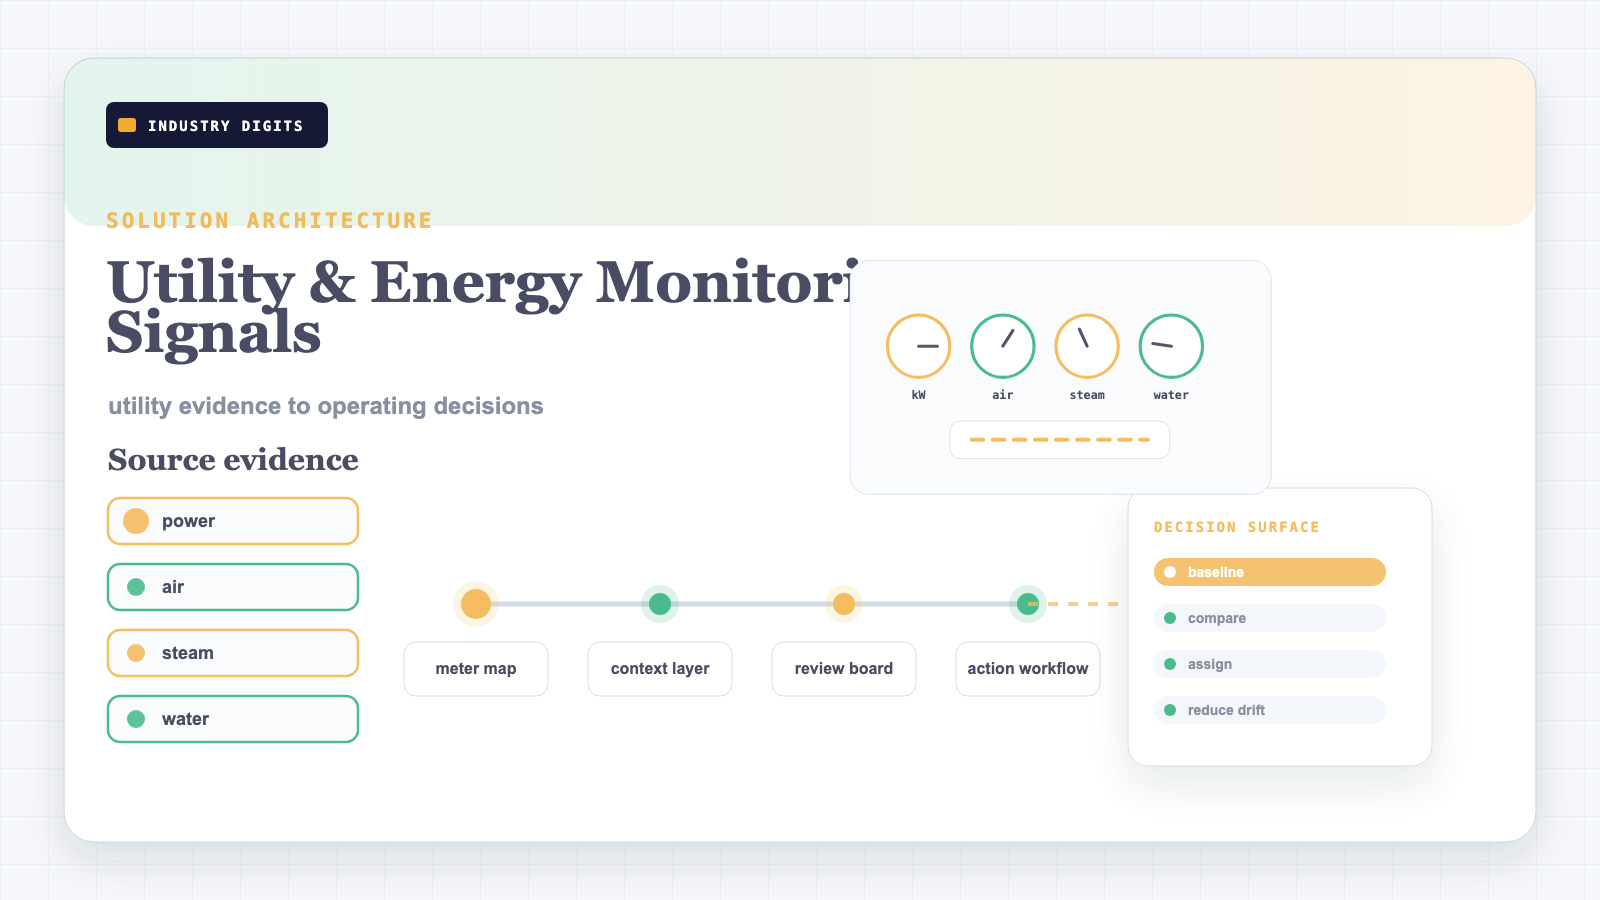
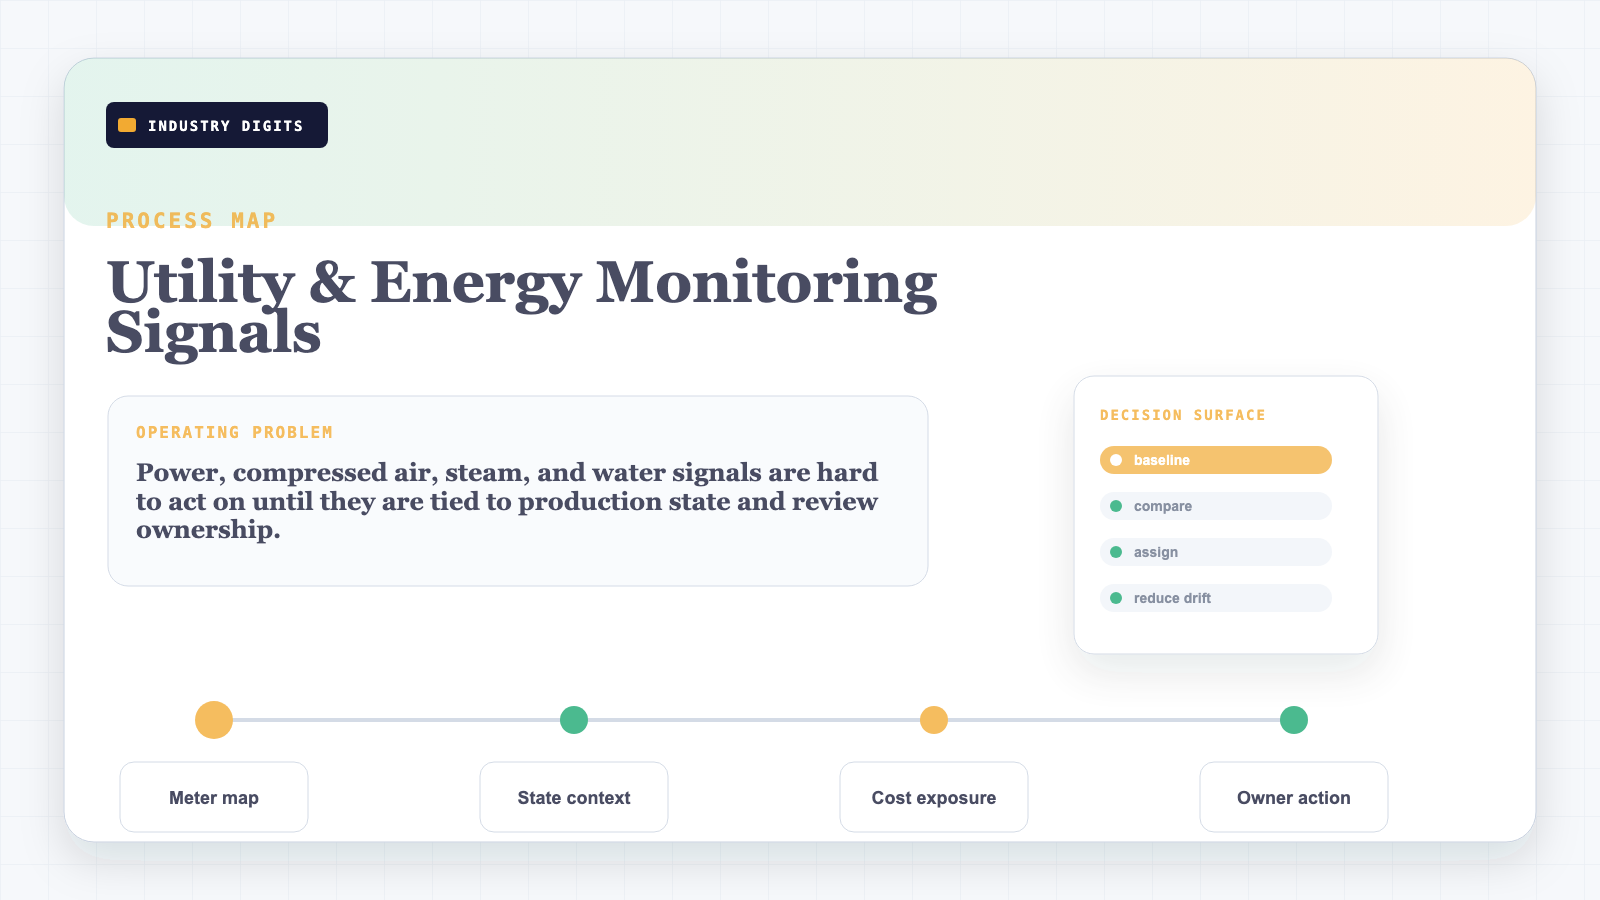
Utility energy monitoring process map from signal capture to state-aware review and action ownership
Process map: how the issue moves from signal evidence to review and action.
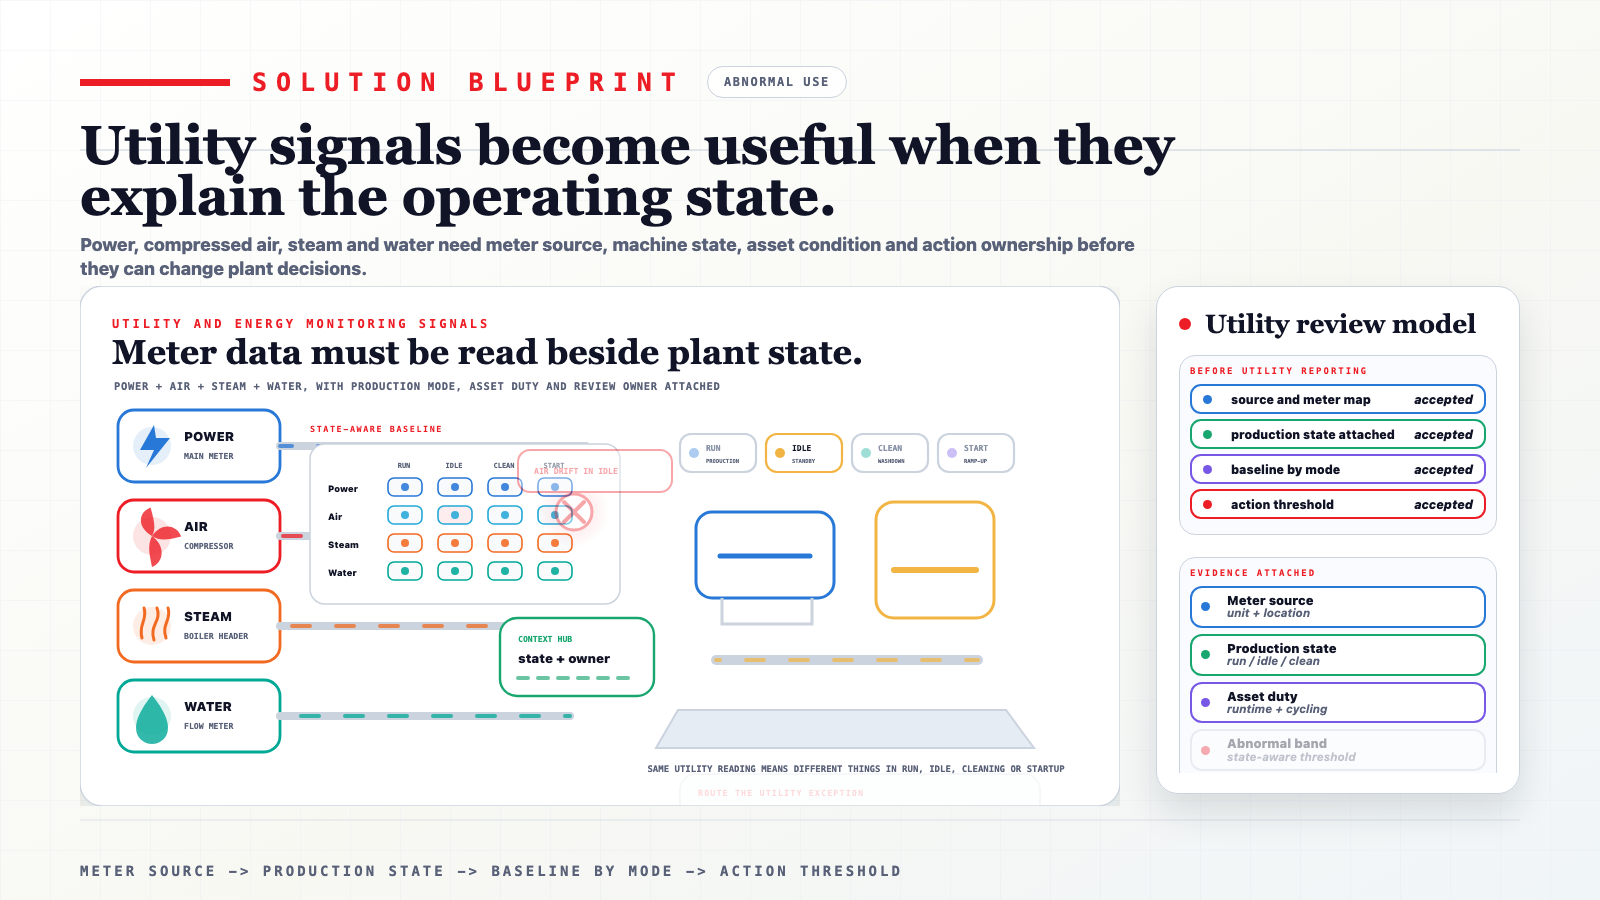
Utility and energy monitoring architecture with meters, production context, edge collection, dashboard, and action workflow
Architecture view: sources, data path, decision surface, and owner-backed action.
Solution architecture

What has to connect before scaling

Source and meter map Identify meters, PLC tags, historian data, compressor controls, run hours, and manual utility records.
Production context Attach production state, line state, shift, product, utility mode, or process state to the signal.
Review dashboard Show peaks, drift, abnormal state usage, and asset indicators with clear review cadence.
Action workflow Route issues to operations, maintenance, controls, or energy review with a documented cost model.
30 / 60 / 90 day path

A release path that earns trust before scale

These stages are planning ranges. The real cadence depends on plant access, signal quality, risk, and ownership.

30 days

Map utility signals and decisions

Choose one utility domain, identify source signals, define production context, and agree what action the review should trigger.

60 days

Build state-aware review

Connect meter or equipment signals with production state, run hours, and first abnormal-use bands.

90 days

Close action and cost exposure

Run recurring reviews, document findings, create assumption-backed cost models, and decide whether to expand the utility scope.

Required signals

The data contract is the practical proof surface.

Each signal needs ownership, unit, context, quality, and review logic. Without that contract, dashboards and alerts become fragile.

Meter or load Unit, meter location, timestamp, sample interval, asset or area owner, and expected normal band.
Production state Running, idle, cleaning, startup, product, shift, line state, or process state connected to the utility reading.
Run hours or cycling Compressor, pump, fan, boiler, chiller, or utility asset runtime, starts, duty mode, and maintenance context.
Action threshold Watch band, review owner, escalation condition, and documented cost-exposure formula.
Explainer video brief

Utility & Energy Monitoring Signals Blueprint

Show how utility signals become useful when connected to production state, asset condition, review cadence, and action thresholds.

0-10s Late utility evidence

Utility data arrives too late unless it is tied to operating context.

10-24s Context layer

State-aware baselines separate normal from waste.

24-42s Review cadence

Reports need owners and action thresholds.

42-60s Action workflow

Energy intelligence works when someone can change the next decision.

Related reading

Articles connected to this blueprint

Field guides and standards references that deepen the methods this blueprint depends on.
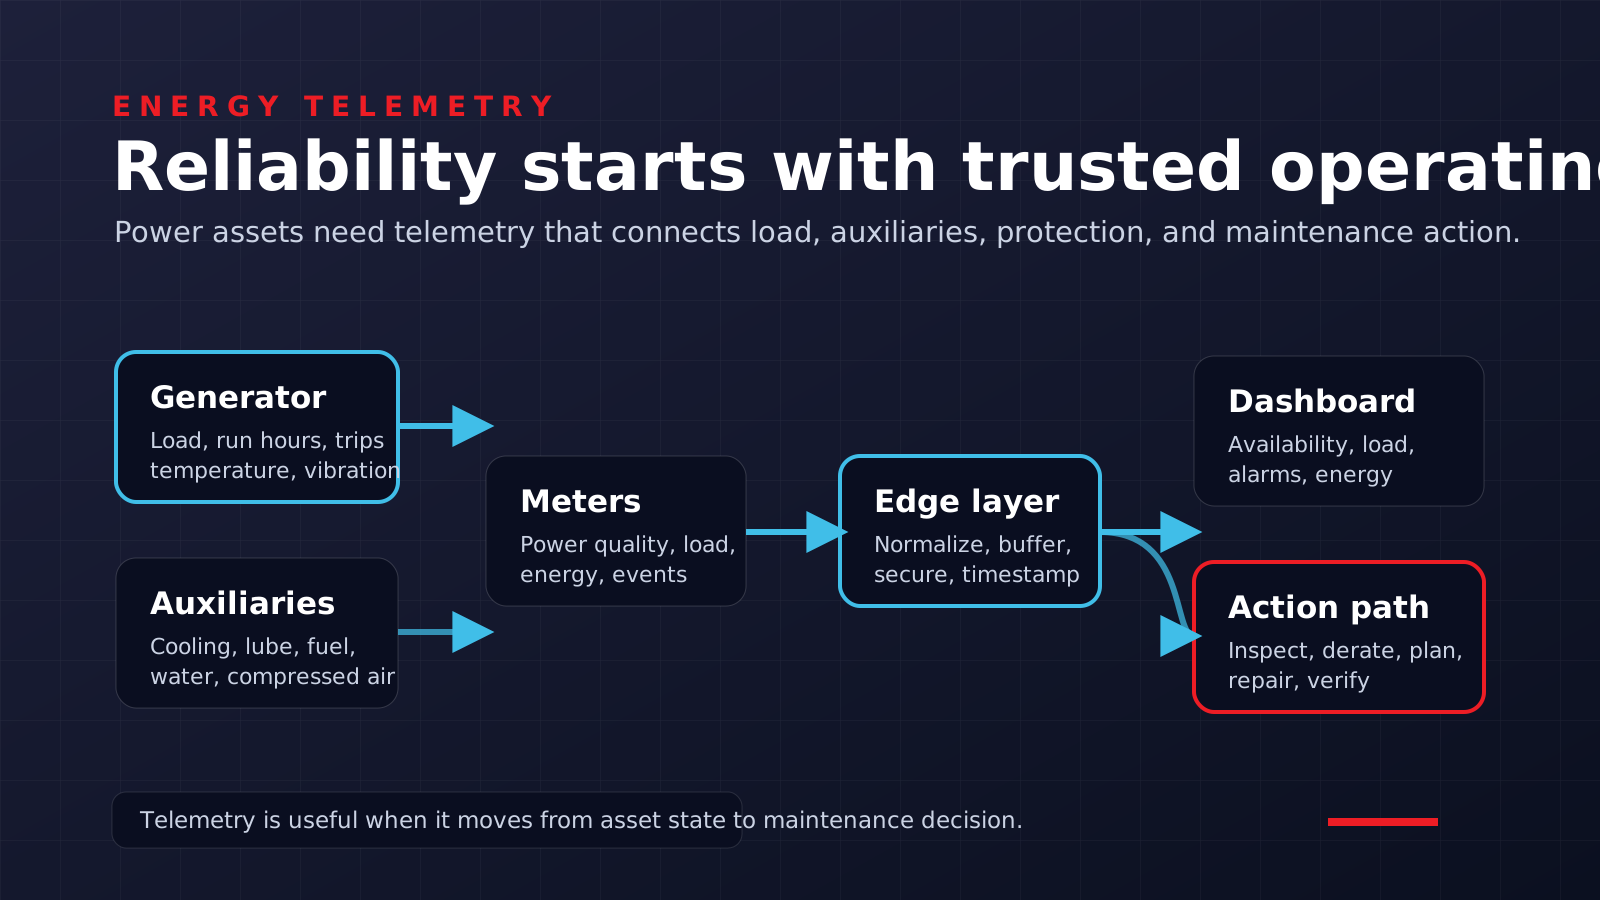
Power generation telemetry architecture connecting generator, auxiliary systems, meters, edge gateway, dashboard, and maintenance action Energy & Power

Power Generation Automation And IIoT: Reliability, Telemetry, And Maintenance Decisions

A practical reliability guide for power generation and energy assets where automation, IIoT telemetry, and condition monitoring must protect continuity.
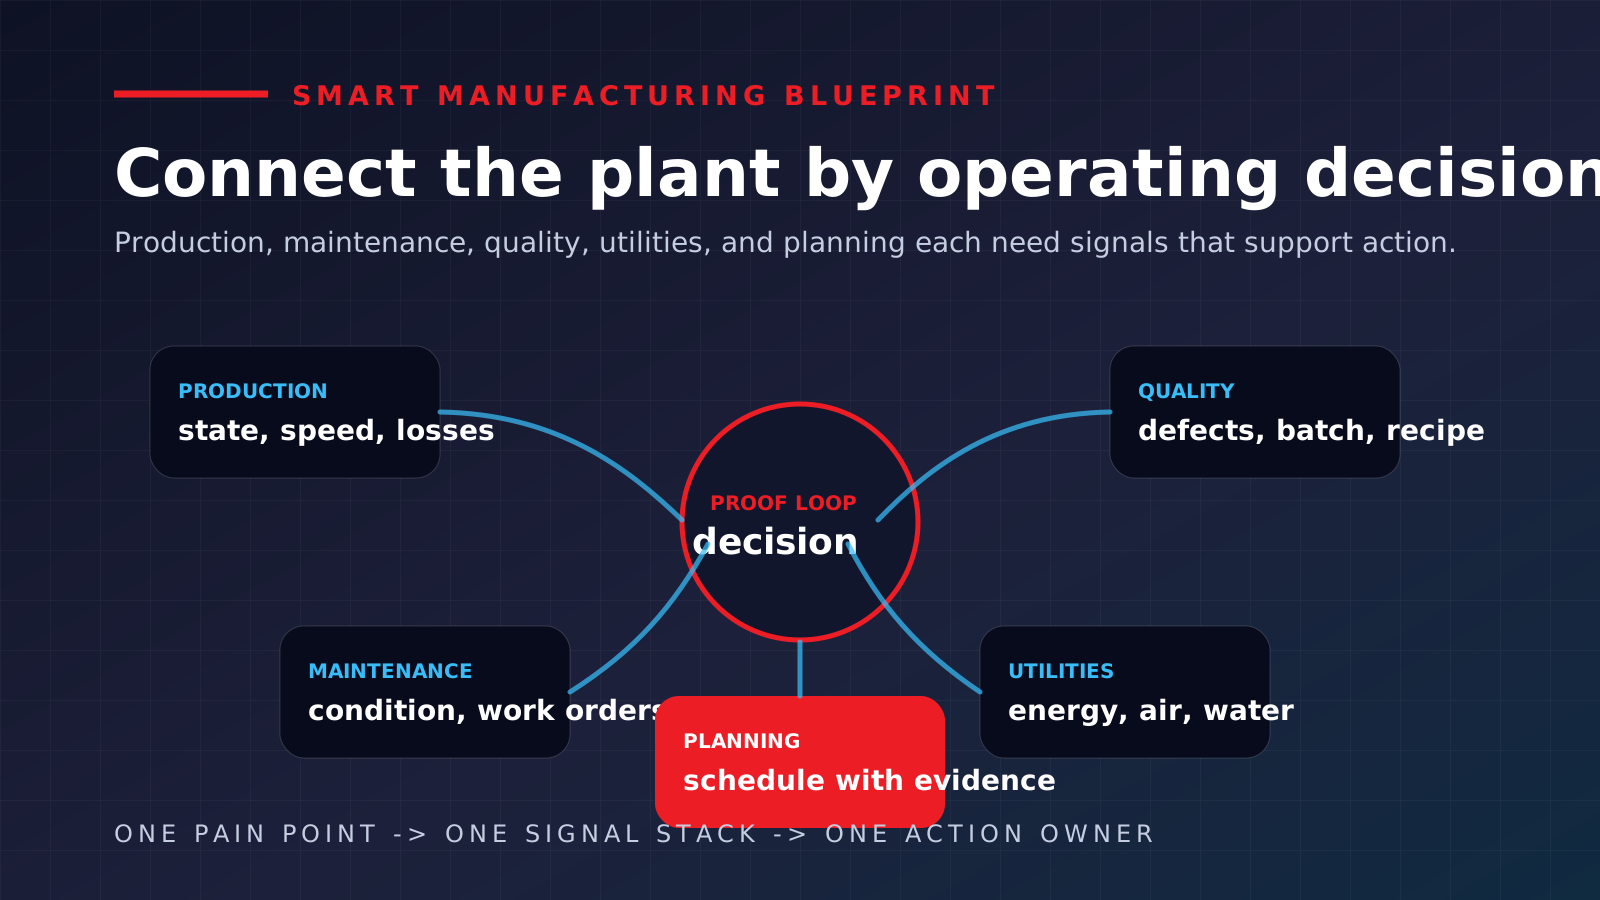
Smart manufacturing blueprint showing production, maintenance, quality, utilities, and planning connected to a decision proof loop IIoT

Smart Manufacturing With IIoT: A Practical Blueprint Before You Call It Industry 4.0

A grounded smart manufacturing blueprint for connecting production, maintenance, quality, utilities, and planning without overclaiming transformation.
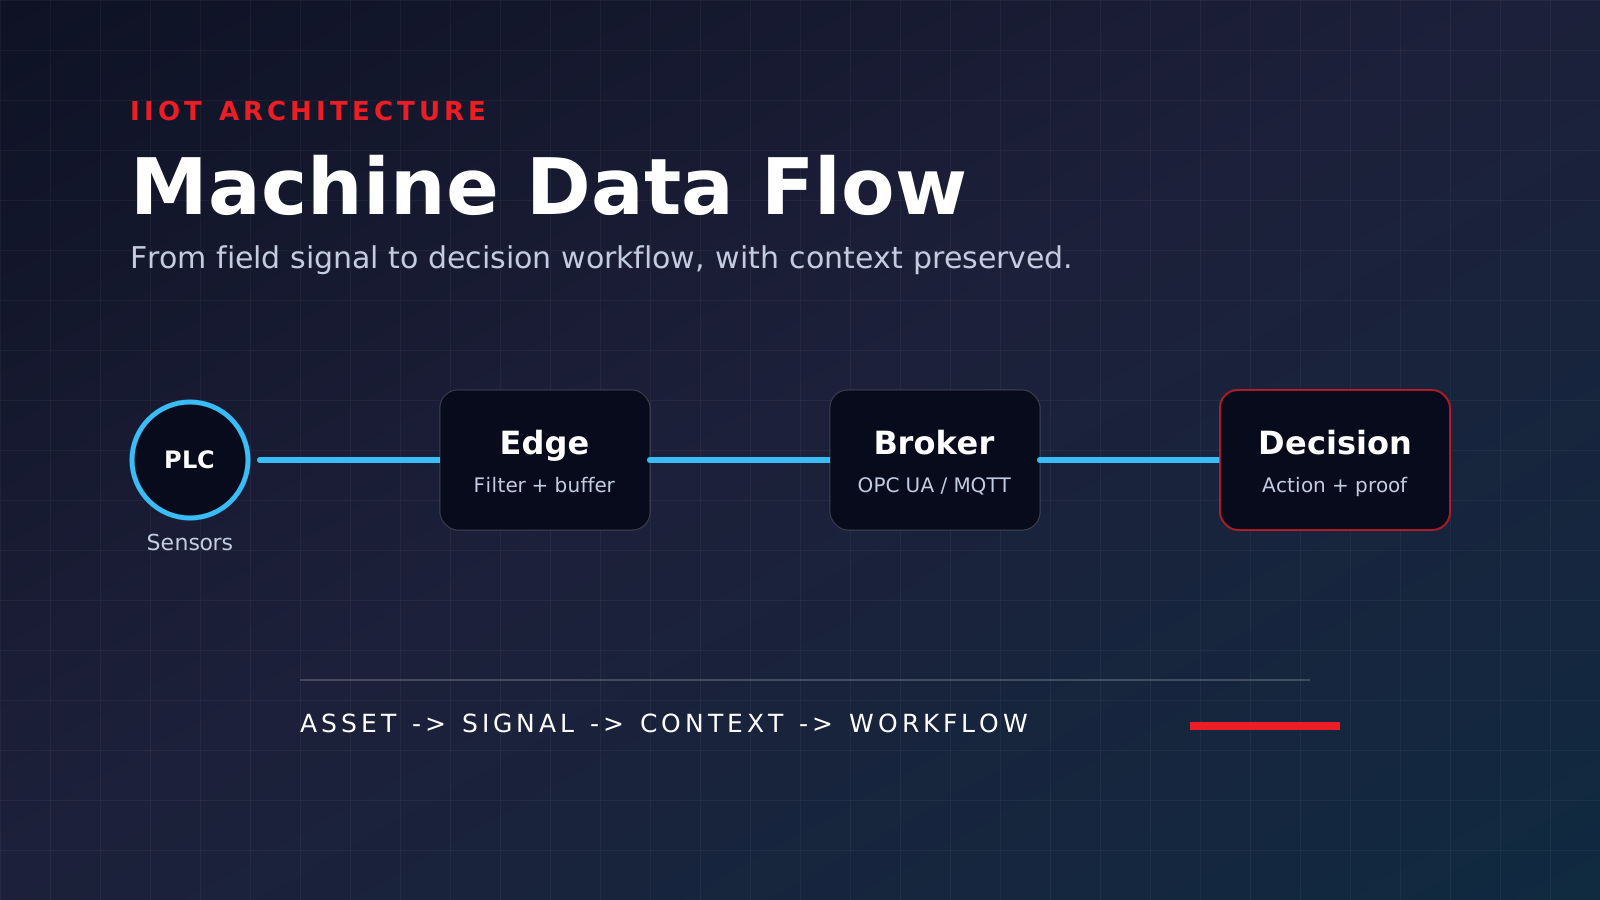
IIoT machine data flow from PLC and sensors through edge, broker, and decision workflow IIoT

IIoT Architecture For Machine Data Flow: Turning Plant Signals Into Strategic Decisions

A refined IIoT architecture guide for turning machine signals, PLC data, and sensor context into decisions that improve uptime, maintenance, energy, and production confidence.
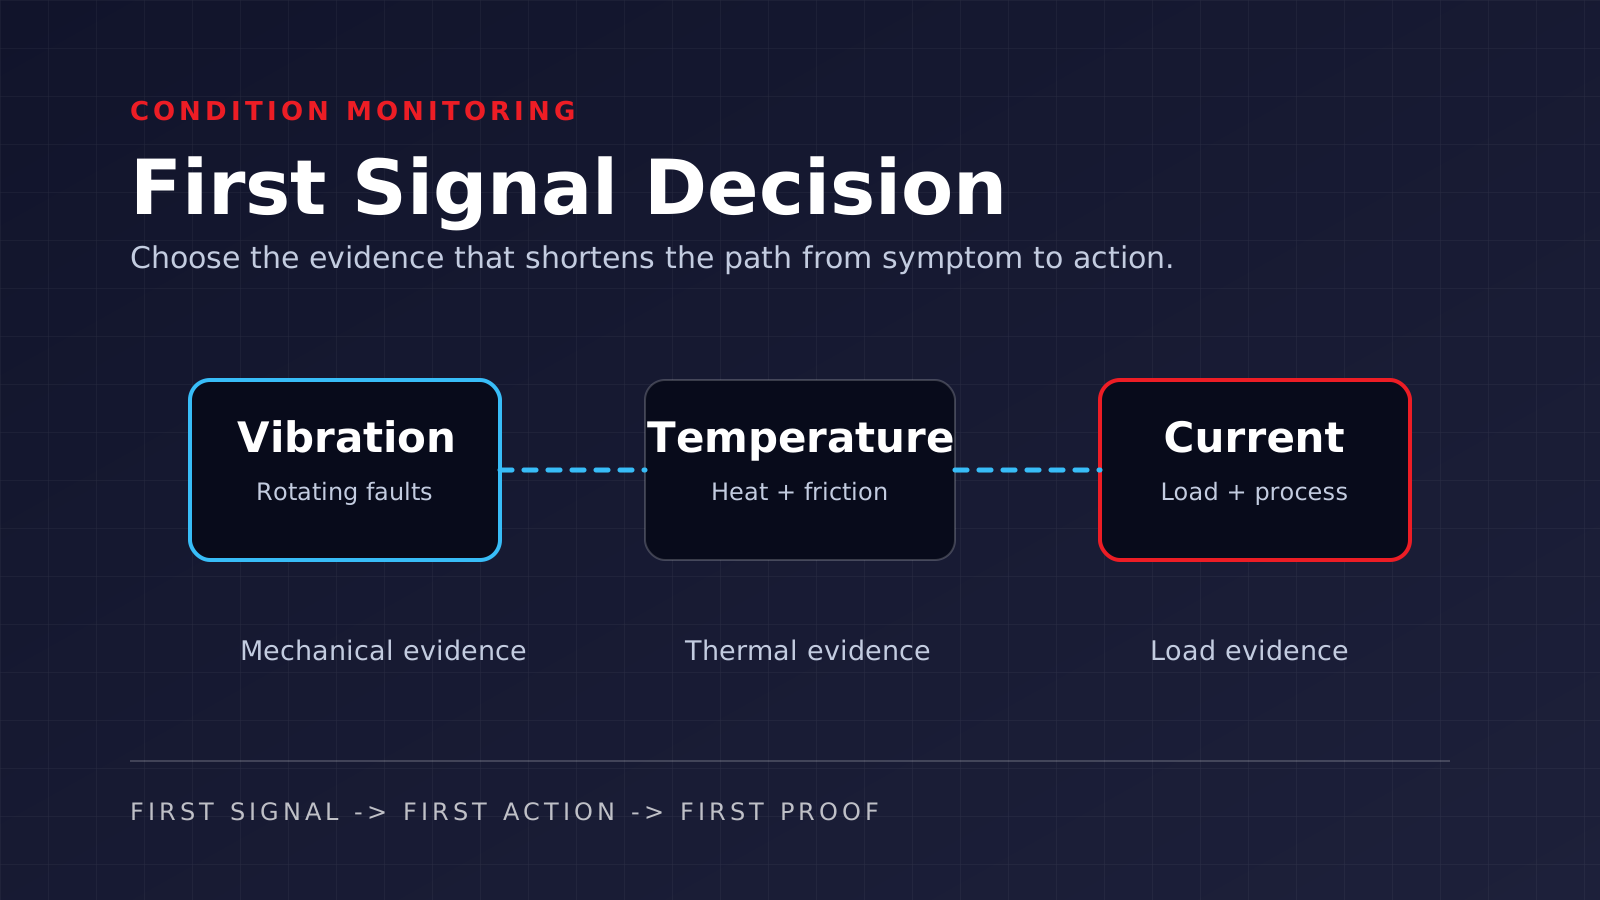
Decision tree comparing vibration, temperature, and current as first condition monitoring signals Condition-Based Monitoring

Thermal, Vibration, Or Current: Choosing The First Signal That Earns Trust

A condition monitoring decision guide for choosing the first signal that builds trust, protects maintenance capacity, and gives earlier warning on critical assets.
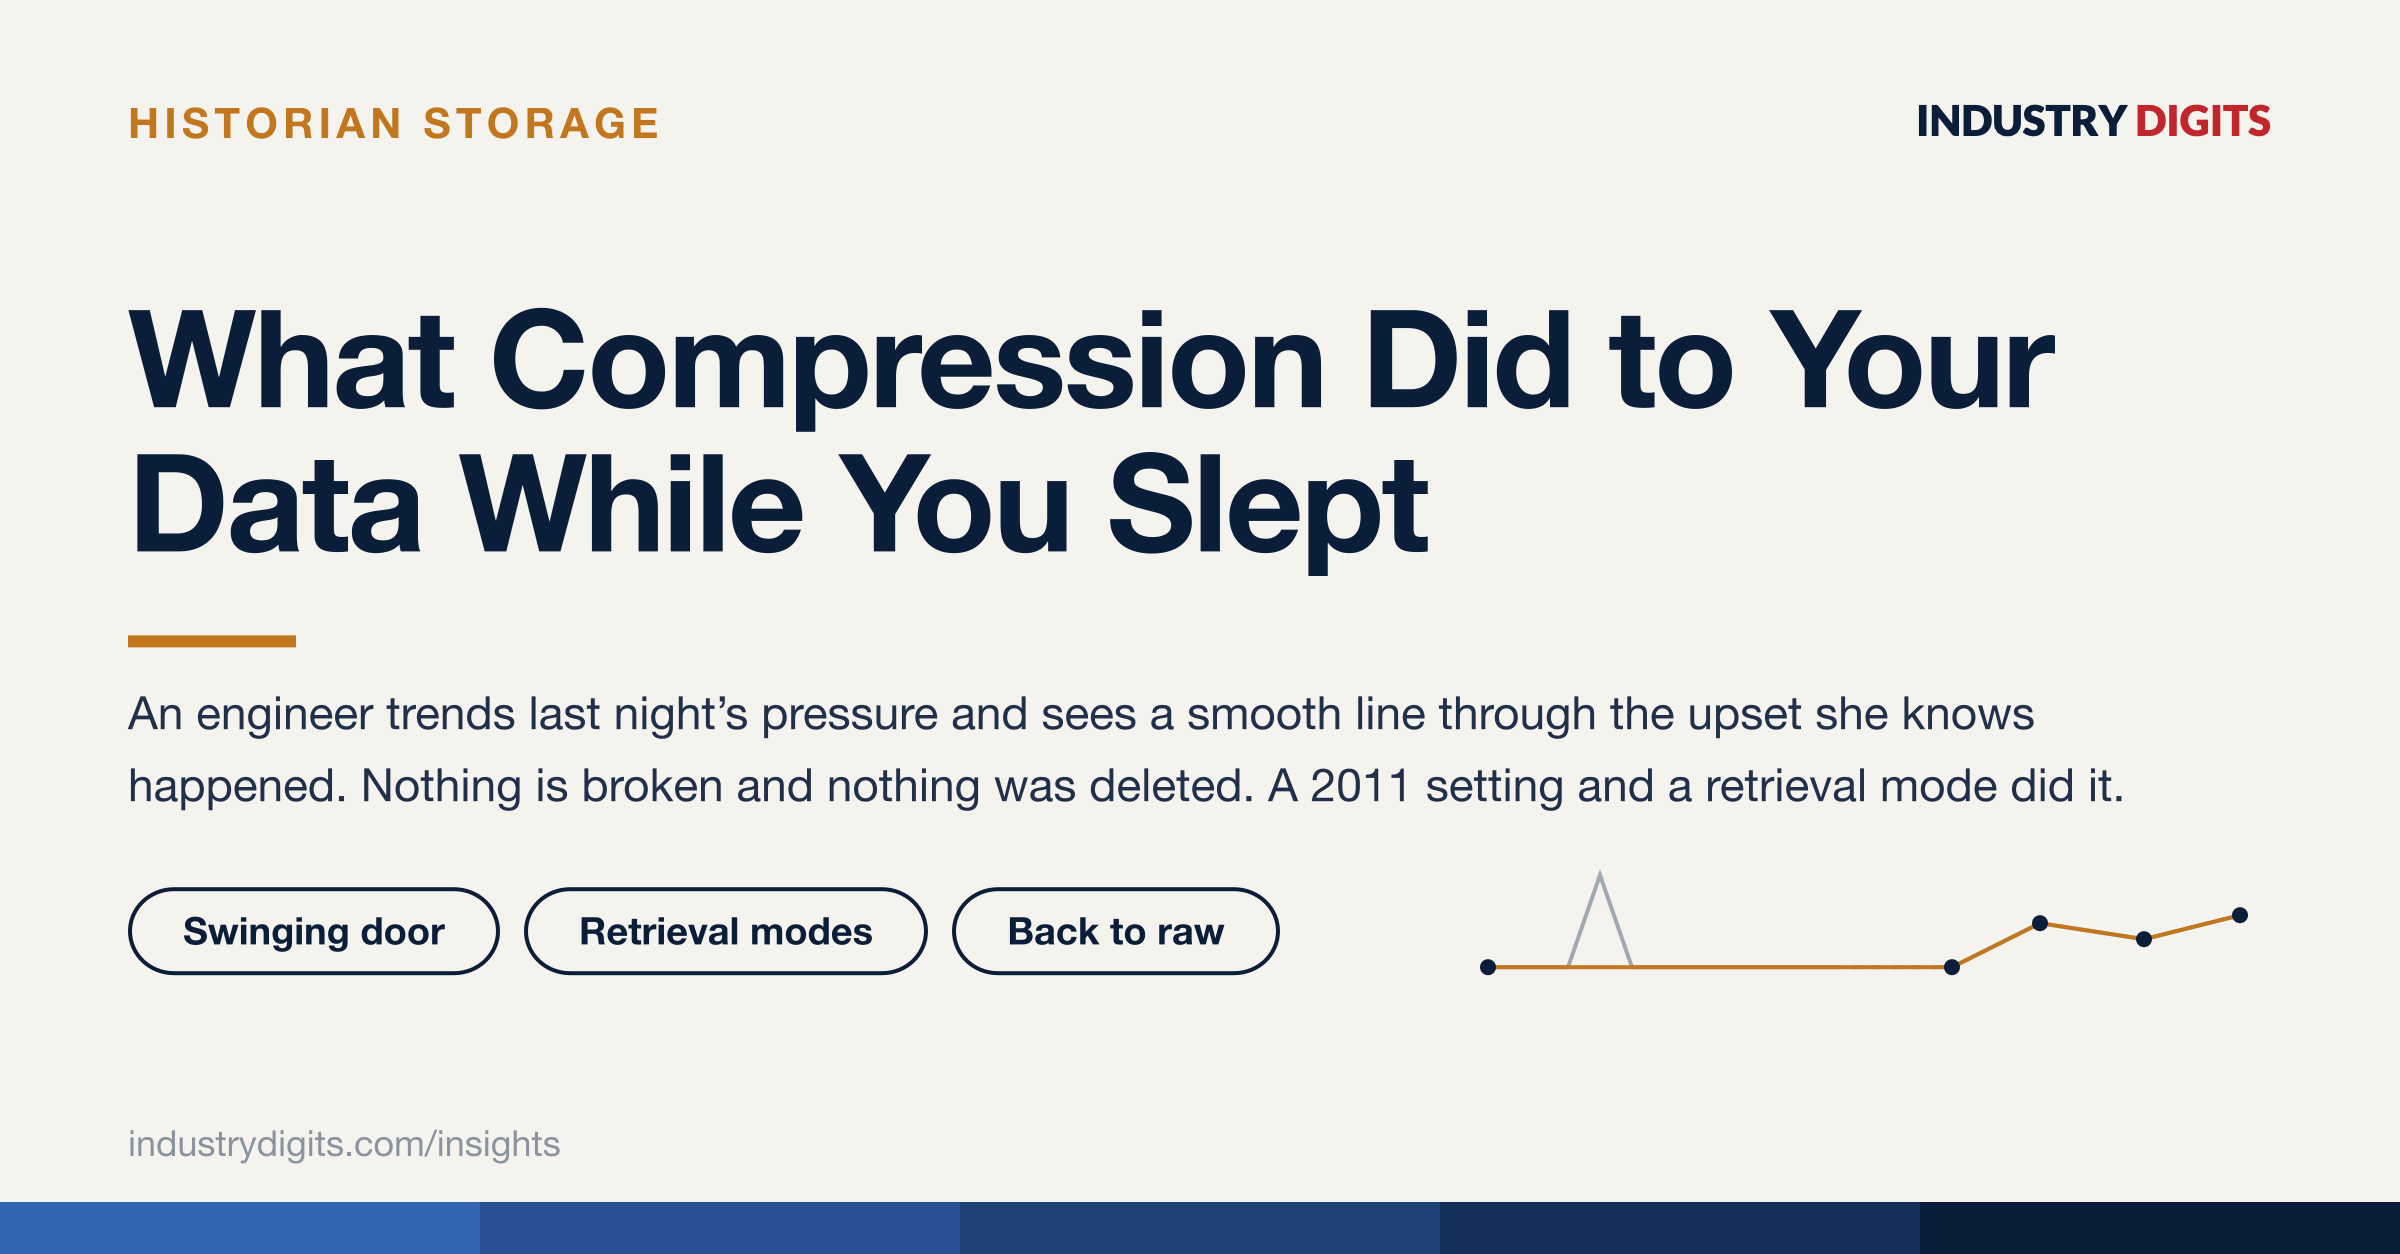
Article cover: what compression did to your data while you slept. IIoT

What Compression Did to Your Data While You Slept

An engineer trends last night's pressure and sees a smooth line through the upset she knows happened. Nothing is broken and nothing was deleted. A compression deviation set to save disk in 2011 and a retrieval mode that paints straight lines through gaps did the rest.
Article cover: build the industrial data chain backwards from the decision. IIoT

Build the Data Chain Backwards From the Decision

Eight links carry a plant reading from a physical condition to somebody's judgement, and value is created at the last one only. Built forwards from the sensors, the chain produces a very complete record of nobody looking at anything.
Article cover: four gates a measurement passes before any sensor is priced. IIoT

Four Gates a Measurement Passes Before Any Sensor Is Priced

A sensor is a claim about the future: that some decision, some day, will be made differently because this measurement exists. The claim is testable in minutes, before a single wire is run, and failing it on paper is free.
Article cover: six IIoT data-chain field cards. IIoT

Six IIoT Data-Chain Field Cards

Six one-page cards for the records an industrial data project keeps skipping: the decision test, the load statement, the timestamp audit, the retrieval modes, the data contract and the chain health signals. Questions and record fields only.

Ready to see what automation could do for your plant?

Discuss Your Project