
Six IIoT Data-Chain Field Cards
Six one-page cards for the records an industrial data project keeps skipping: the decision test, the load statement, the timestamp audit, the retrieval modes, the data contract and the chain health signals. Questions and record fields only.

Six one-page cards for the records an industrial data project keeps meaning to write down and never does: the decision test, the load statement, the timestamp audit, the retrieval modes, the data contract and the chain health signals.
Each card carries questions and record fields, and nothing else. No scan rates, no deadband values, no headroom fractions, no compression deviations — because those come from your own process, your own network and your own consequences, and a number borrowed from somewhere else is the fastest way to lose an argument with an auditor. Every card also carries the one-line boundary the underlying reference states at that point, and the section it came from.
No signup, no email, no form — download what you need.
01 · The decision test
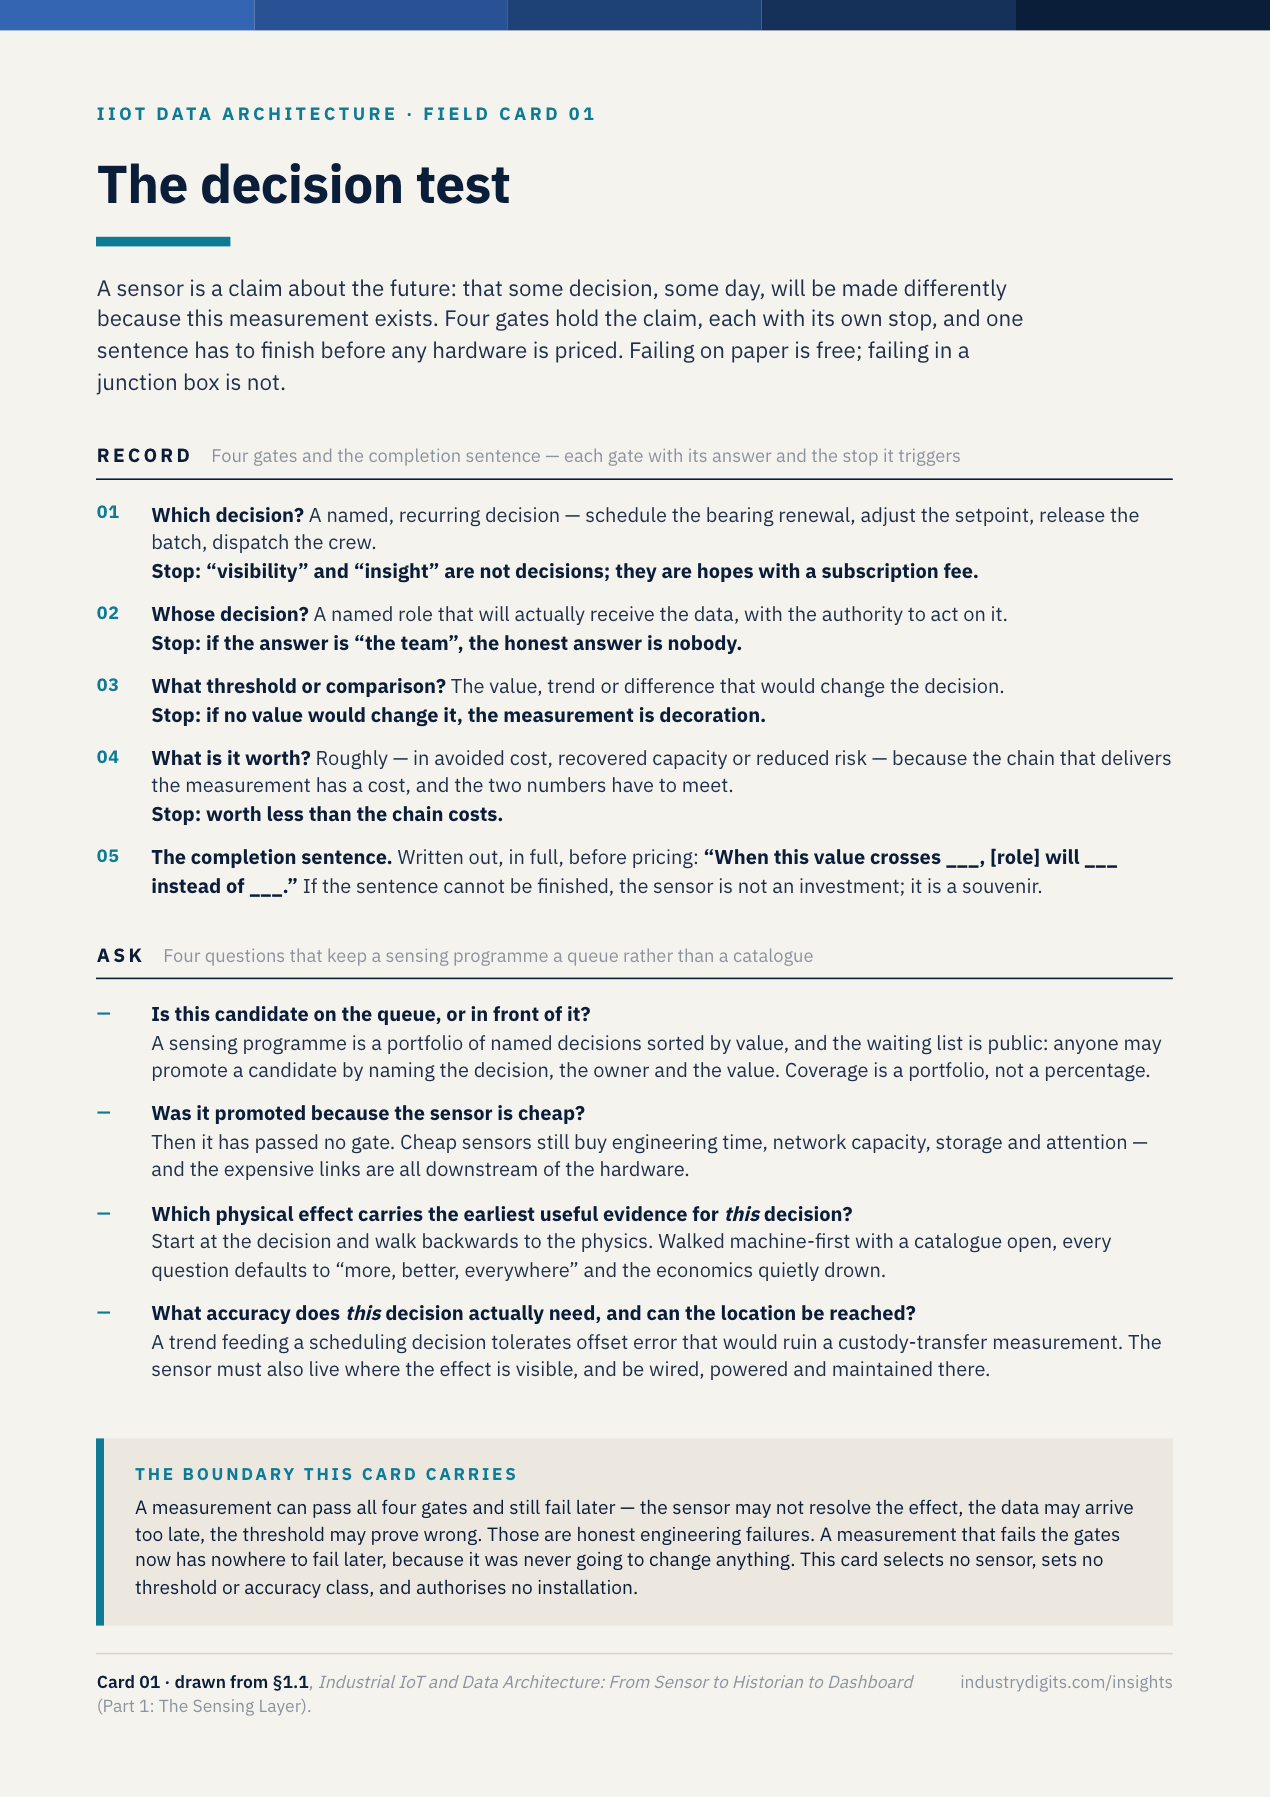
A sensor is a claim that some decision, some day, will be made differently because this measurement exists — and the claim is testable in minutes, before a wire is run. Four gates hold it: which decision, whose decision, what threshold would change it, what it is worth. The card records the answers and closes with the sentence that either finishes or does not: when this value crosses ___, [role] will ___ instead of ___.
Download card 01 (PDF) · Pairs with Four Gates a Measurement Passes Before Any Sensor Is Priced
02 · The load statement
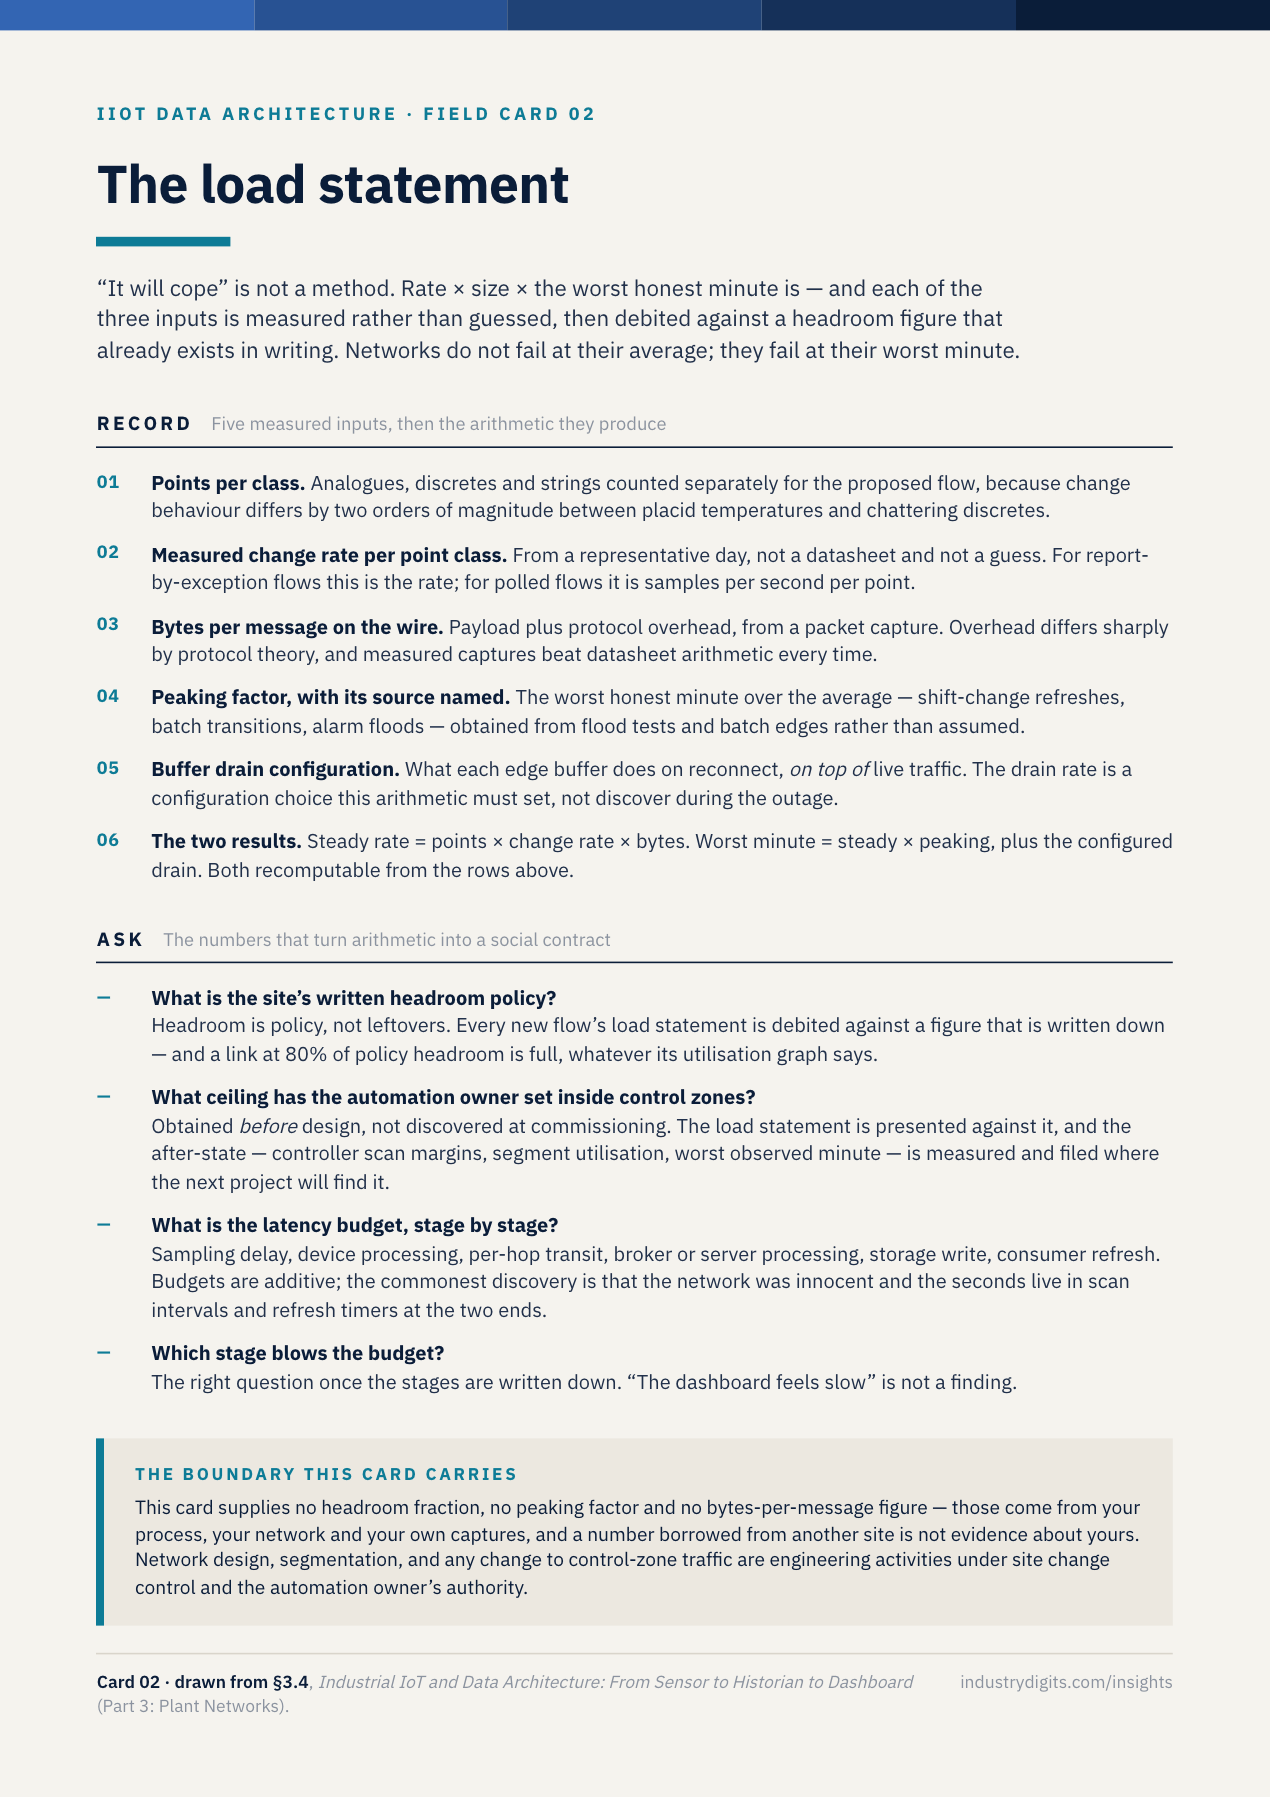
“It will cope” is not a method. Rate times size times the worst honest minute is, and each of the three inputs is measured rather than guessed: change rate per point class from a representative day, bytes per message from a packet capture, peaking factor from flood tests, batch edges and the configured drain rate of every edge buffer. The card also records the two numbers that turn arithmetic into a social contract — the site’s written headroom policy, and the automation owner’s ceiling on added load inside control zones.
Download card 02 (PDF) · Pairs with Where Data Is Born: The Birth Certificate Your Chain Inherits
03 · The timestamp audit
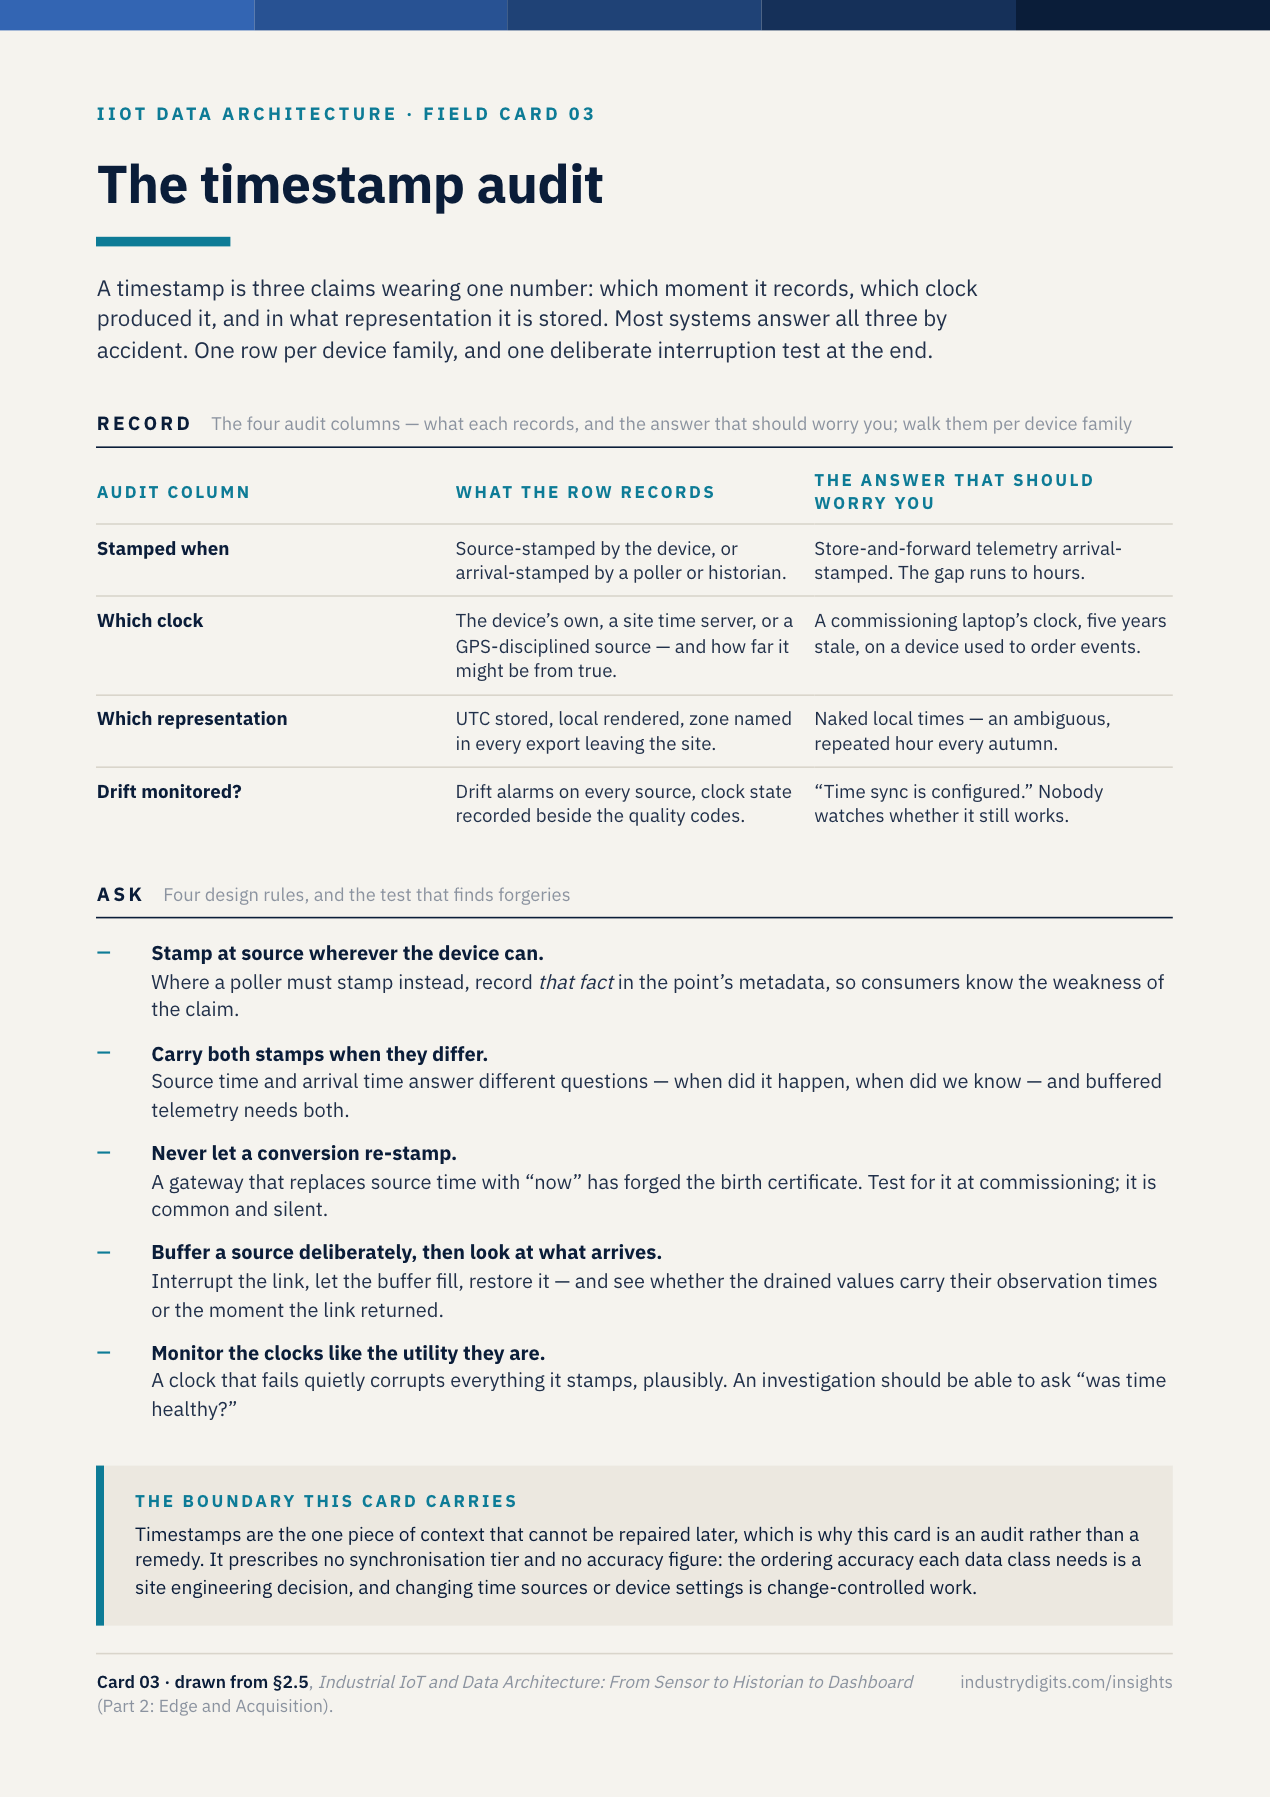
A timestamp is three claims wearing one number: which moment it records, which clock produced it, and in what representation it is stored. Most systems answer all three by accident. The card takes one row per device family and records who stamps, which clock, UTC or local, whether drift is monitored — and closes with the test that finds forgeries: buffer a source deliberately, then check whether the drained values arrive with their observation times or with the moment the link came back.
Download card 03 (PDF) · Pairs with Time Is the Quietest Way a Data Chain Lies
04 · The retrieval modes
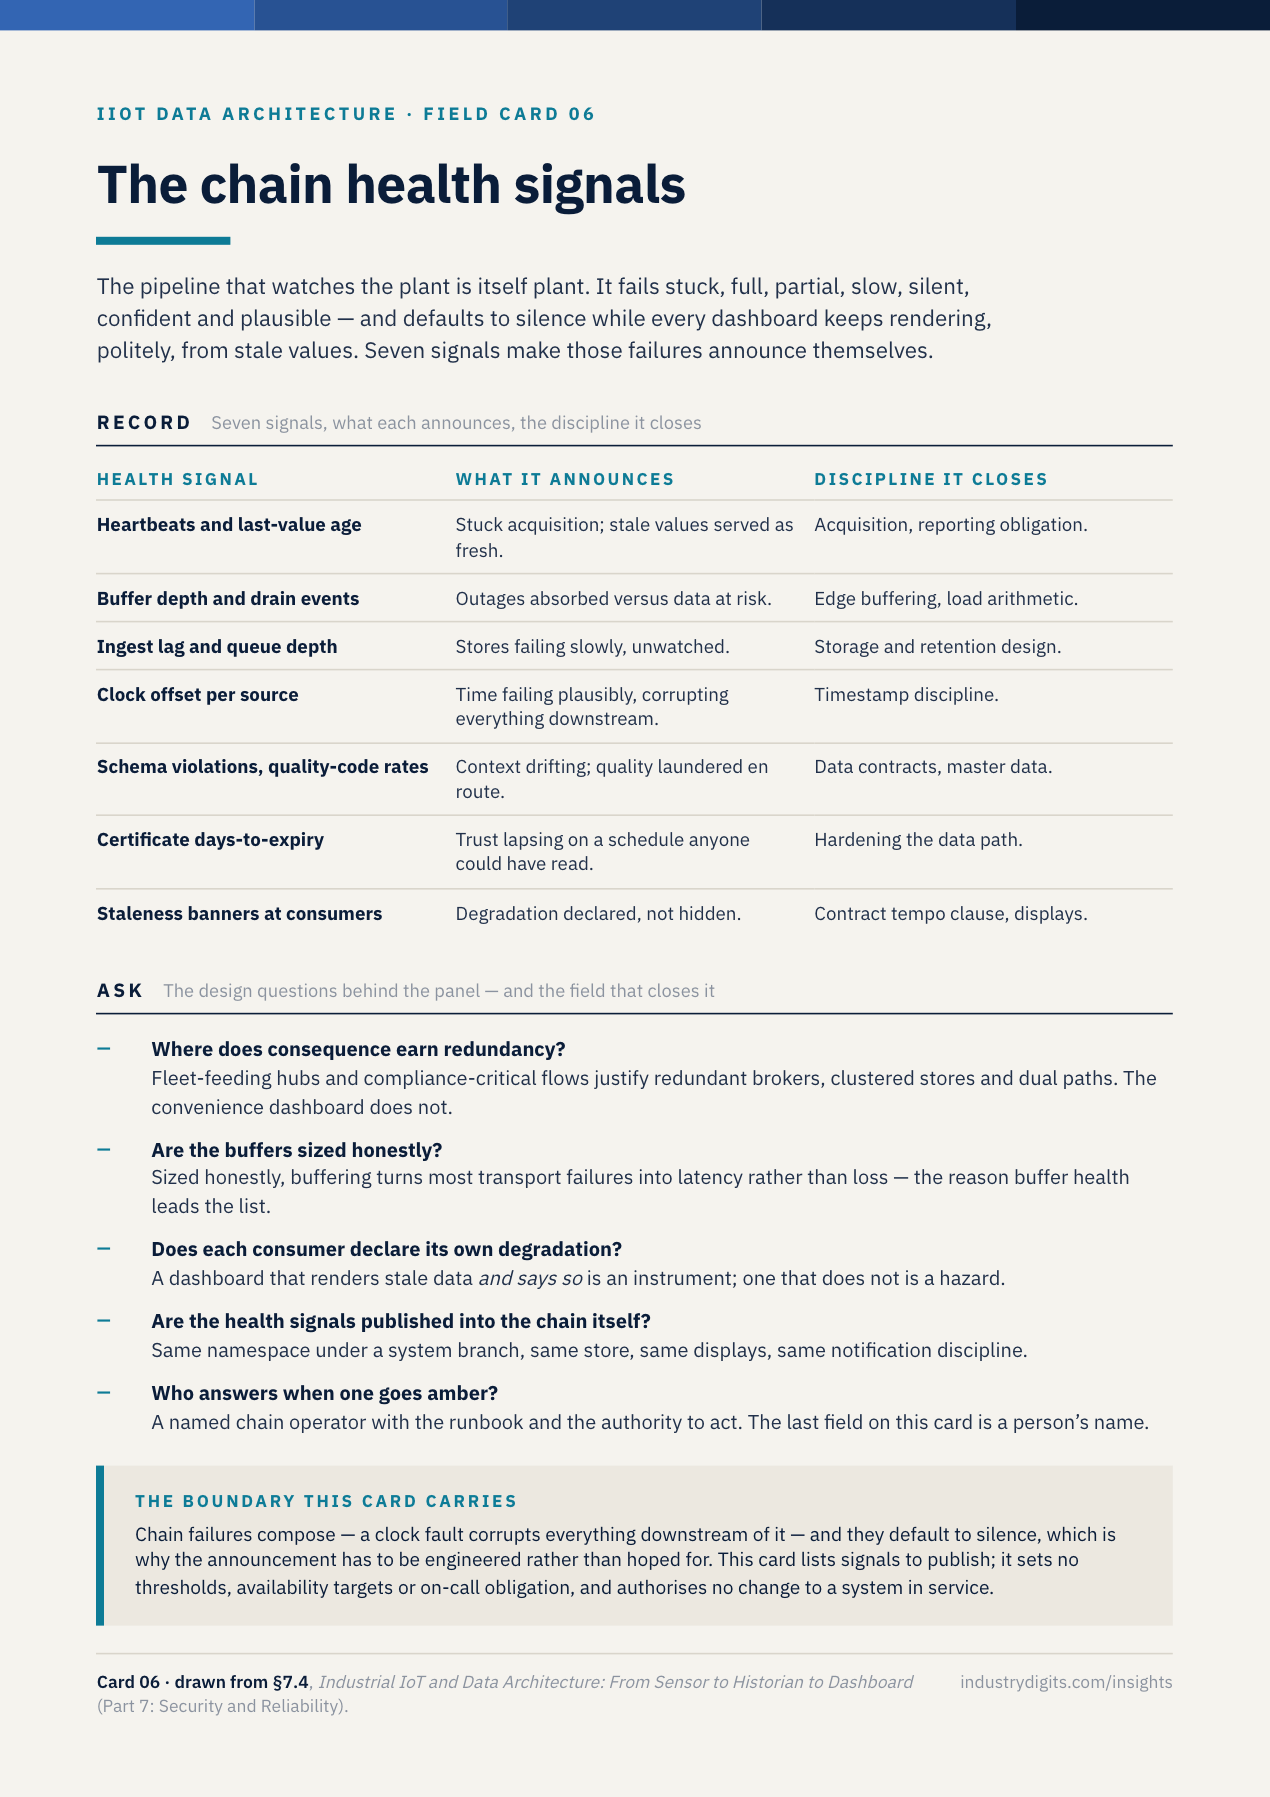
What comes back from a query is not the data. It is a mode applied to whatever survived compression, and a consumer who does not know which mode they asked for is being confidently misled. The card names the four modes — raw, interpolated, aggregate, stepped — with what each is honest for and where each lies, alongside three rules: match the mode to the signal’s semantics, distinguish no data from no change, and take every investigation back to raw.
Download card 04 (PDF) · Pairs with What Compression Did to Your Data While You Slept
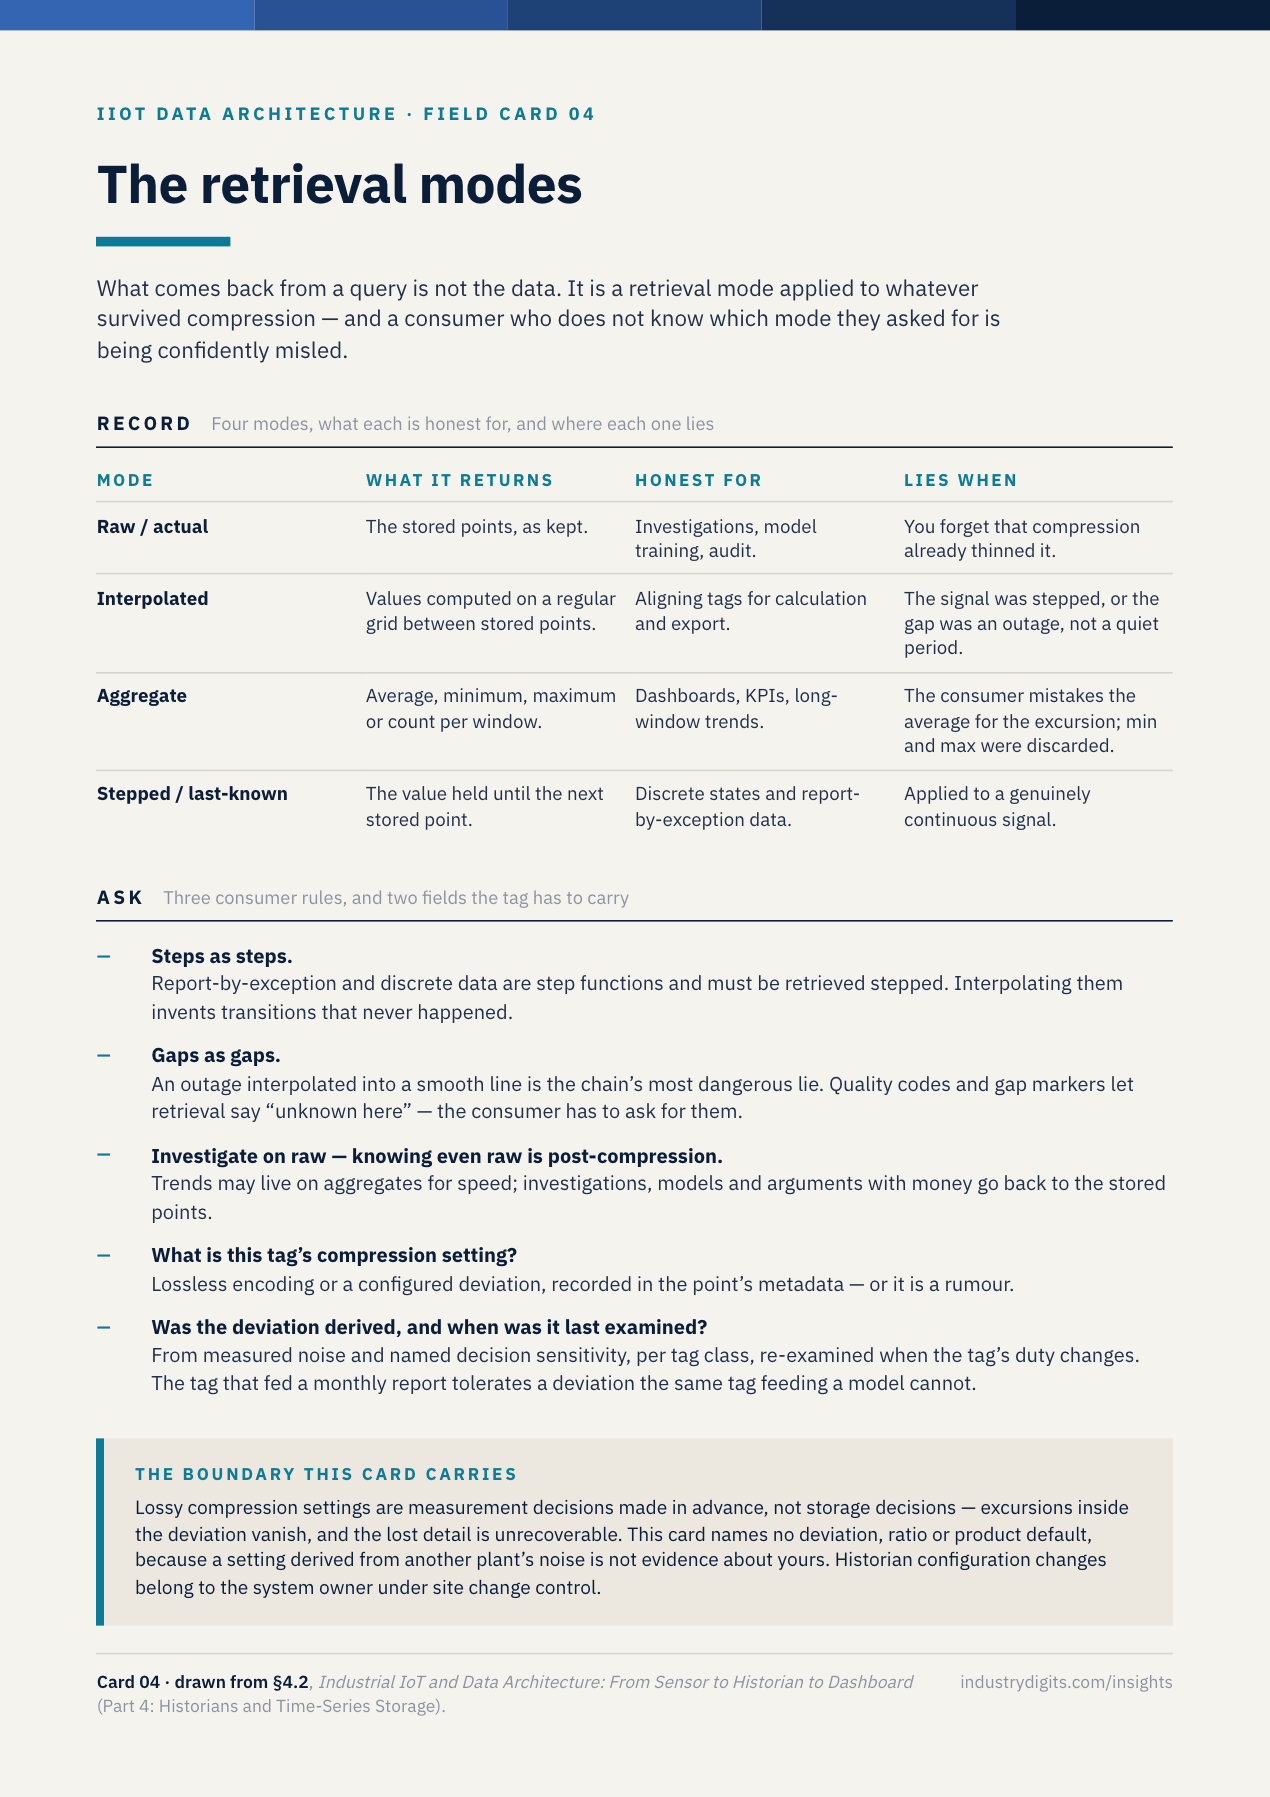
05 · The data contract
An interface is where meaning dies, and a contract is how it survives. Five clauses gather what Parts 1 to 5 already established and put it at the boundary where it has always been lost: identity, semantics, shape, tempo, stewardship. The card records each clause with the defect class it retires, and names the enforcement that keeps a contract from becoming shelfware — schema validation at entry, automated point-list checks, and a contract-version field in the payload so drift is detectable rather than archaeological.
Download card 05 (PDF) · Pairs with The Unified Namespace Is a Pattern, Not a Product
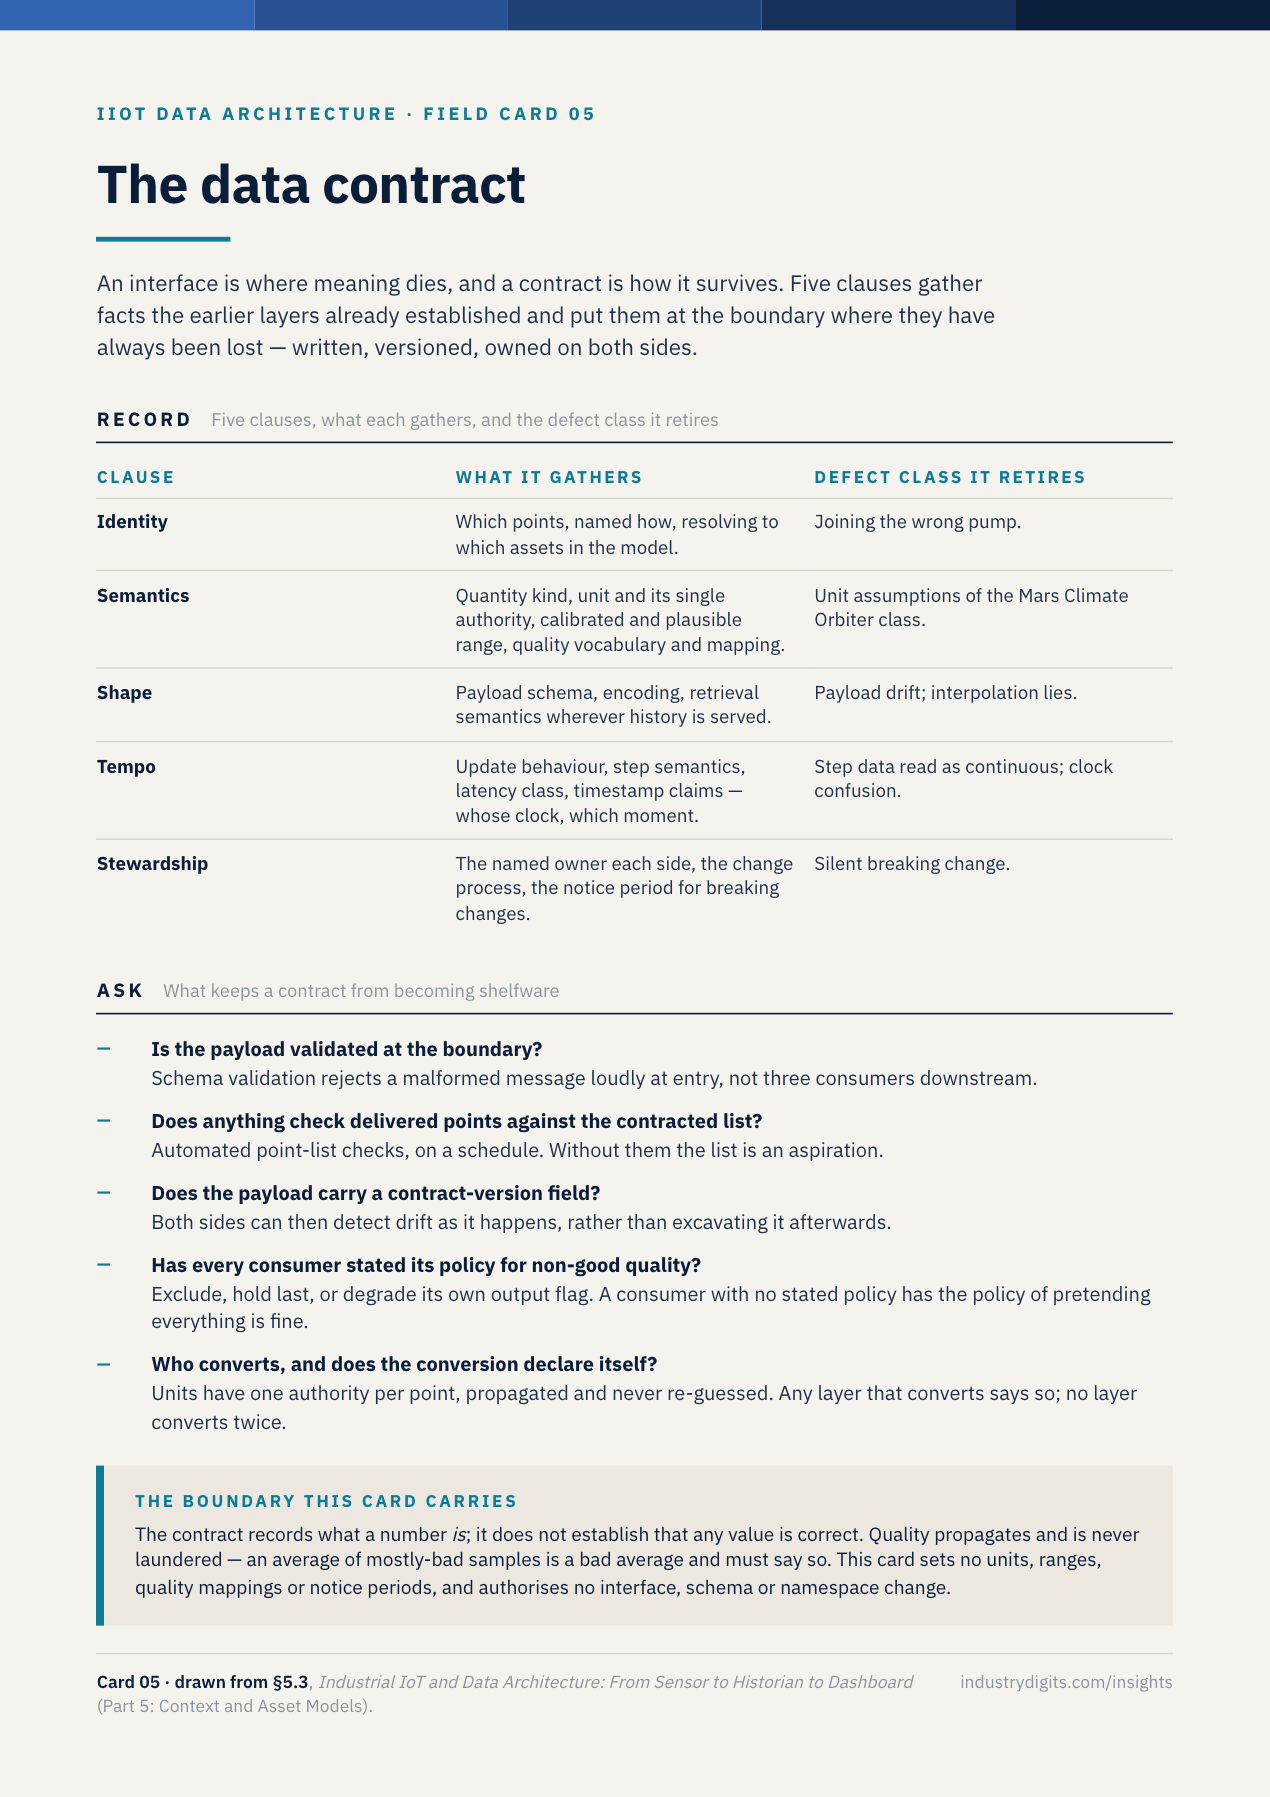
06 · The chain health signals
The pipeline that watches the plant is itself plant: it fails stuck, full, partial, slow, silent, confident and plausible, and it defaults to silence while every dashboard keeps rendering. The card lists the seven signals that make those failures announce themselves — collector heartbeats and last-value age, buffer depth and drain events, ingest lag and capacity margins, clock offset per source, schema violations and quality-code rates, certificate days-to-expiry, and staleness banners honoured at the consumer — plus the field that closes the Part: the named role that answers when one goes amber.
Download card 06 (PDF) · Pairs with Notifications Are Not Alarms, and the Line Has to Be Architectural
What these cards are, and what they aren’t
They are records: what to write down, what to ask of it, and what the answer cannot establish. They are deliberately not fillable forms, sizing calculators or configuration tables.
Every card stops exactly where your own plant’s numbers begin. Card 02 gives the load arithmetic and refuses to supply a headroom fraction. Card 03 names the three timestamp claims and declines to prescribe a synchronisation tier. Card 04 lists the retrieval modes and names no compression deviation. That is not caution for its own sake — a rate, a fraction or a deviation that came from another plant’s process, network and consequence profile is not evidence about yours, and it is the first thing a reviewer will find.
Each card also carries the boundary its source section states, in one line, at the point where a reader might otherwise act. Where the record cannot be completed, the honest entry on all six is the same: NOT DEMONSTRATED — a verdict in its own right, not a failure of nerve.
Print one. Fill it in by hand against a data flow you already argue about. You will know very quickly which of the six your project is missing.
Which of the six cards describes a record your data project does not currently keep?
The record fields, the review questions, and the one-line boundaries printed on each card are drawn from the sensing, acquisition, network, storage, context, dashboard and security parts of Industrial IoT and Data Architecture: From Sensor to Historian to Dashboard (sections 1.1, 2.1, 2.5, 3.4, 4.2, 5.3, 6.3 and 7.4).
Lokesh Chennuru writes Industry Digits field notes for industrial decision makers, focused on automation, IIoT, condition monitoring, predictive maintenance, and industrial AI.
Connect on LinkedInQuestions industrial leaders ask about this
Are the field cards free to download?
Yes. All six cards and the combined six-card PDF download directly, with no signup, no email and no form. They are method references — what to record and what to ask — and they are yours to print, post on a cabinet door or hand to a project team.
What is on each card?
Questions and record fields, and nothing else. Each card carries a RECORD block listing the fields a decision has to fill, an ASK block listing the questions that test them, the one-line boundary the underlying reference states at that point, and the section it was drawn from. There are no thresholds, no rates, no sizing rules and no authorisation on any of the six.
Why do the cards contain no numbers?
Because a scan rate, a deadband, a headroom fraction or a compression deviation that came from one plant's process, network and consequence profile is not evidence about another's. The cards carry the method that produces your numbers — the fields to record, the arithmetic to compute from your own measurements — and deliberately stop where a borrowed setting would begin.
Which article does each card pair with?
Card 01 pairs with the four-gate decision test article, card 02 with the acquisition and read-without-breaking article, card 03 with the timestamp article, card 04 with the compression and retrieval article, card 05 with the unified namespace article, and card 06 with the notifications article. Each card also names the section of the underlying reference it was drawn from.
Can these cards be used to change a plant setting?
No. They structure a review and make its gaps visible. Scan rates, deadbands, compression deviations, network configuration, protocol servers and notification rules on operating systems are engineering changes under the site's management-of-change process, security policy, OEM instructions and qualified approval.
Industrial IoT and Data Architecture — From Sensor to Historian to Dashboard
The nine-part reference this series draws on: the data value chain, the sensing layer, edge and acquisition, plant networks, historians and time-series storage, context and asset models, dashboards and analytics, security and chain reliability, and the implementation playbook — 40 sections covering signal families, protocol theories, timestamp discipline, compression and retrieval, tag naming, asset models, data contracts, notification engineering, threat modelling, and the pilot-to-wave economics a finance function can audit.