
From “Everything Is Important” to an Ordered List
Ask a plant which machines are critical and the honest answer is usually all of them. Criticality analysis is the method that turns that answer into a queue — by fixing the criteria, the anchors and the arithmetic before anybody starts scoring, and by naming what the ranking never gets to decide.


Ask a plant which of its machines are critical and you will usually be told: all of them.
That answer is not obstruction. It is the honest output of a question with no method behind it. Every machine is somebody’s problem at 3 a.m., and without a shared yardstick the loudest and most recent pain wins — so the sensor budget, the engineering attention and the data-cleaning effort all flow toward whoever tells the best story, while the quiet single point of failure waits.
In 1949 the U.S. military published procedure MIL-P-1629, matured three decades later into MIL-STD-1629A: procedures for performing a failure mode, effects and criticality analysis. The standard was cancelled in 1998 and the practice continued in IEC 60812 and industry FMECA work, but its central insight outlived it. Consequence and likelihood must be assessed separately, explicitly, and before the argument starts.
What follows is one worked method — not the method. Every choice in it changes the resulting order, which is why the choices get made and written down first.
Fix the method before you score anything
The consequence criteria should mirror what the business actually protects: safety and environment, production, quality, cost of the failure event, and spares or repair response — that last one most often left out and most often decisive, because a long-lead item turns a small failure into a long one.
Each criterion gets written anchors at 1, 3 and 5, with 2 and 4 available where a case sits between them and the reason written into the cell. Score against the worst credible event, not the worst imaginable: meteor-strike scoring inflates everything to 5 and destroys the resolution. Use the worst event that has happened here or at a comparable plant, and say which one.
Two anchor sets are inescapably local: money bands follow your own cost base and your finance function’s materiality threshold, and response-time anchors follow your actual supply chain rather than a catalogue lead time. A plant that copies somebody else’s numbers there has already lost the audit.
Aggregation and weighting is a choice, not a formula. Summing five criteria at equal weight, then multiplying by likelihood, is one rule — chosen for transparency rather than because the criteria are commensurate, since safety is plainly not interchangeable with spares lead time. Other plants weight safety double, or take the single highest criterion instead of the sum, or keep safety out of the arithmetic entirely as an override. Each rule produces a different order and none is more correct in the abstract.
The rule is fixed before scoring starts, and nobody adjusts it once the room can see who wins. That discipline, not the arithmetic, is what makes a ranking defensible.
Likelihood is an argument about evidence
Consequence is an argument about physics and money. Likelihood is one about evidence, so anchor it to observable rates rather than how worried anyone feels.
| Score | Evidence anchor — events per year, this asset or its class |
|---|---|
| 1 | rarer than about one in 20 years |
| 2 | about one in 5 to 20 years |
| 3 | about one in 1 to 5 years |
| 4 | one to four a year |
| 5 | more than about four a year |
Score from CMMS history where it exists, class history where the record is thin, structured judgement where neither exists — flagging the judgement so data can replace it later.
Then do the part that costs nothing and saves the analysis: record the source of each score in the cell. A 4 from a memory and a 4 from eleven work orders are not the same 4, and only one survives a challenge. Where the evidence is missing or disputed, record NOT DEMONSTRATED and keep the entry open rather than settling on a confident number. That is a legitimate result, not a failure of nerve — and like every evidence state, it authorises nothing on its own.
The ranking that surprised the room
At Meridian — an illustrative composite plant, not a client — folklore held that the packaging line’s labeller was the problem child: most work orders, loudest complaints. The half-day utilities workshop scored the screw compressor K-201 instead.
Safety 1: no personnel exposure in the credible failure. Production 5: air feeds both lines, and the standby K-202 had failed its last changeover test. Quality 4: in-process product scrapped on both lines. Cost 5: the last event’s repair and collateral ran past the top money band. Spares response 5: airend rebuild on a three-week lead.
Consequence 1 + 5 + 4 + 5 + 5 = 20. Likelihood 3 — two events in three years is about 0.67 a year, inside the one-in-1-to-5-years band. Criticality 20 × 3 = 60, top of the plant.
The labeller scored 1 on safety, production, quality and cost — a 30-minute buffer downstream absorbs its stoppages and its parts are on the shelf — and 2 on spares response. Consequence 6, likelihood 5, because it stops most weeks. Criticality 6 × 5 = 30: a nuisance, not a risk.
The first call on the sensor budget went to K-201, the failed changeover test got fixed for the cost of a Saturday, and the labeller went to a root-cause review rather than to instrumentation. The loudest asset and the most critical asset were not the same machine. They rarely are — and these numbers are Meridian’s, recomputable from the scores and the likelihood scale printed above, and transferable to nothing.
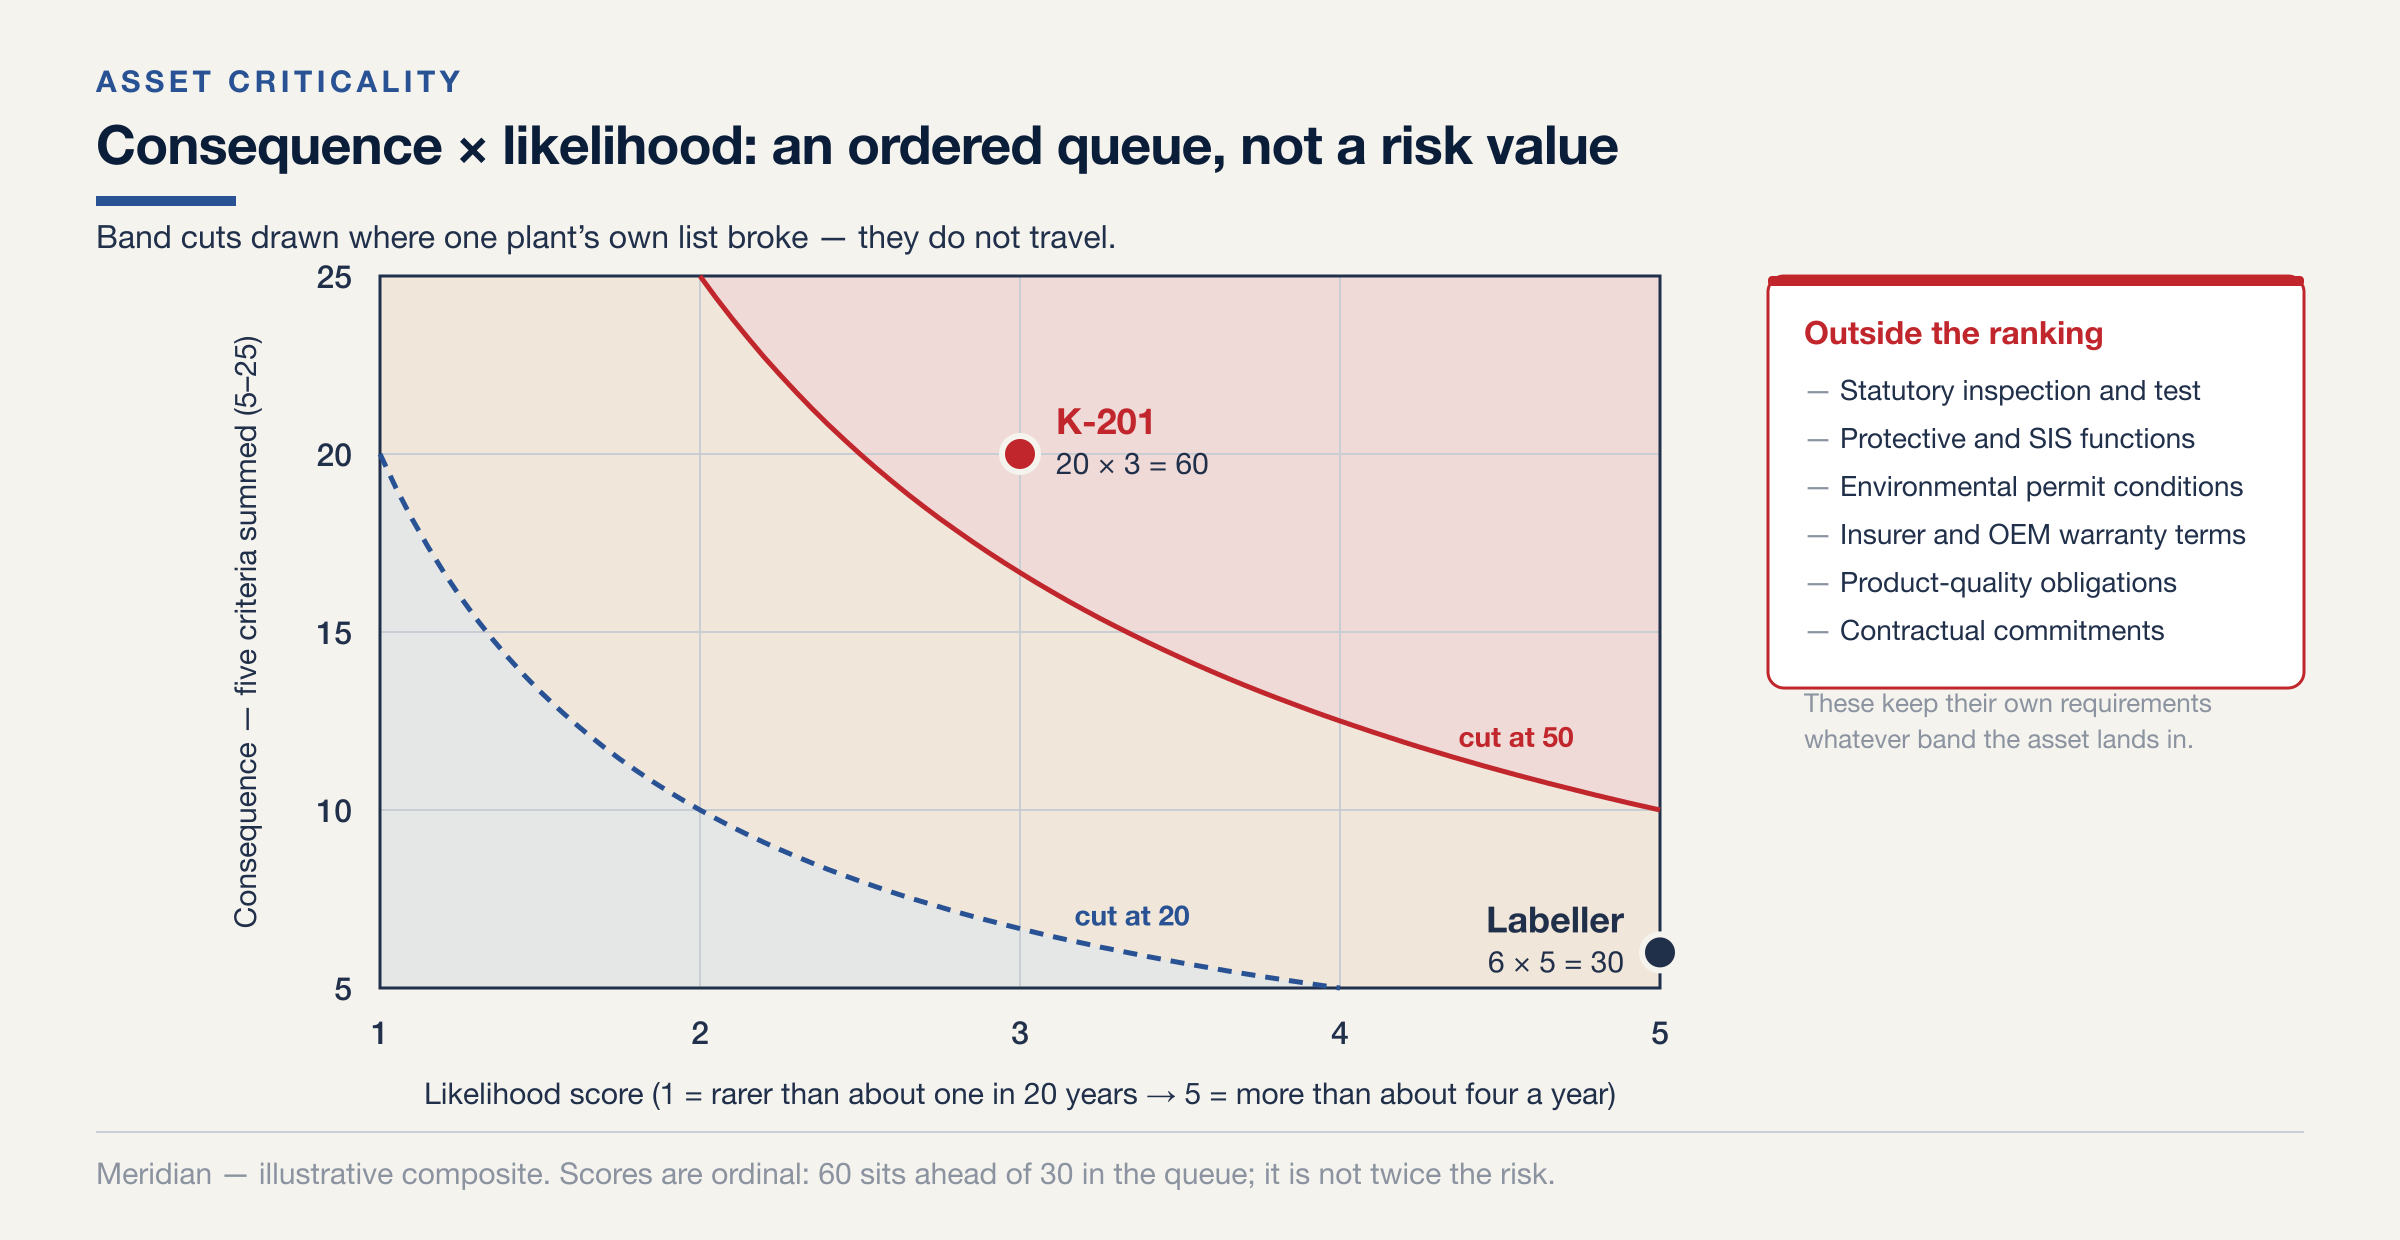
Meridian’s product runs from 5 to 125, and it cut the top band above 50 and the bottom below 20 because that is where its own list broke. Plot your distribution before choosing cuts. Expect the top band to be a small minority; if it is not, the scale has no resolution and the room has been scoring fears.
What the ranking does not get to decide
Used past one boundary, a ranking stops being an engineering artefact.
The override runs the other way too. Many plants promote any asset scoring 5 on safety straight into the top band regardless of the product — a defensible local rule, provided it is written down before scoring with the rest of them.
Two further limits. These are ordinal scores: an asset at 60 sits ahead of one at 30 in the queue, but it is not “twice as critical”, and the product is not a risk figure in any measurable currency. The output is a queue, not a metric, and it should never be presented to finance as a risk value. And the ranking is a dated judgement about assumptions — duty, redundancy, consequence, repair route — that decays as those change. Re-score on trigger, not only on a calendar.
The exercise: half a day, one area, no capital
Criticality is a judgement exercise dressed as arithmetic, and its failure modes are social. Run one area and you will meet them all.
- 01 Get the room right
Maintenance alone overweights repair cost; operations alone overweights last month's pain. You need both, plus a process engineer and someone who speaks for safety and cost.
- 02 Write the rules on the front page
Criteria, anchors, weighting and tie-breaks — printed before the first asset is scored, and not amended once the room can see who wins.
- 03 Score the slot, not the machine
Criticality belongs to the functional location. The duty compressor position is critical; the rebuilt spare in the workshop is not — yet.
- 04 Let redundancy earn its capital
A duty and standby pair with a tested changeover scores production consequence low. An untested standby is a rumour, and scores as if absent.
- 05 Time-box and move
Score at equipment-unit level where the answer could change a decision; class-score the rest in minutes. The analysis that tries to be perfect never ships.
One prerequisite fails silently: the ranking scores register entries. Ghosts that no longer exist on the floor, and the machine called P-101 in the historian and PUMP-101 in the CMMS, corrupt the result without raising an error. If the register has not been walked, walk the area first.
What will probably happen is what happened at Meridian. Somewhere in the first two hours an asset nobody worried about will outrank an asset everybody complains about, and the room will argue. That argument is the deliverable — priorities stated at last in a form somebody can disagree with on the evidence rather than the volume.
And remember what the finished list is for. A ranking says where to spend attention, not what kind; that is the next question, answered per asset against the failure modes it actually has.
Which of your top-band entries can name the specific event its consequence score was anchored to?
The five consequence criteria, the likelihood evidence anchors, the aggregation-before-scoring discipline and the override rules are from Predictive Maintenance: Practitioner Reference Frameworks and Planning Guide (Part 2: Asset Criticality and Maintenance Strategy).
Lokesh Chennuru writes Industry Digits field notes for industrial decision makers, focused on automation, IIoT, condition monitoring, predictive maintenance, and industrial AI.
Connect on LinkedInQuestions industrial leaders ask about this
What is asset criticality analysis?
A method that scores every significant asset on two axes — how bad a failure is, and how often it happens — against written scales, then combines them the same way for every asset to produce a ranking. The output is an ordered queue for engineering attention, monitoring investment, data-cleaning priority and pilot selection. It is not a measurement of risk.
Why must consequence and likelihood be scored separately?
Because when they are left implicit, attention flows to whoever argues loudest and the quiet single point of failure waits. The separation goes back to the U.S. defence procedure MIL-P-1629 of 1949, matured into MIL-STD-1629A in 1980 and continued after its cancellation in FMECA practice under IEC 60812. Consequence is an argument about physics and money; likelihood is an argument about evidence.
How should criticality bands be set?
By plotting your own distribution and cutting where your own list breaks, not by copying anyone else's numbers. Bands are local by construction, because the criteria, the scales and the aggregation rule that produced the scores are local. Expect the top band to be a small minority; if it is not, the scale has no resolution and the workshop has been scoring fears rather than events.
Can a low criticality score justify reducing an inspection?
No. Statutory inspection and test, protective and safety-instrumented functions, environmental permit conditions, insurer requirements, OEM conditions attached to warranty, product-quality obligations and contractual commitments all stand at their own level whatever the arithmetic says. A low band on an asset carrying a statutory test does not shorten, defer or delete that test, and a criticality ranking has no standing to propose that it should.
What can a criticality score not tell you?
It cannot tell you how much risk an asset carries. The scores are ordinal: an asset at 60 sits ahead of an asset at 30 in the queue, but it is not twice as critical, and the product is not a risk figure in any measurable currency. It should never be presented to finance as one. It is also a dated judgement about assumptions — duty, redundancy, consequence, repair route — that decays as those assumptions change.
Predictive Maintenance — Practitioner Reference Frameworks and Planning Guide
The twelve-part reference this series draws on: foundations and the value case, asset criticality and strategy, failure modes and degradation, the monitoring technologies, asset-class playbooks, sensors and IIoT architecture, data foundations, signal processing, analytics and prediction models, alerts and diagnosis, work management and CMMS integration, and pilot execution through rollout and governance — 126 sections with 46 technical figures.