
Bad Actors: The Vital Few Machines Eating the Maintenance Budget
Everything else in a predictive programme is an argument about the future. Bad actors are not — they have already confessed, in your own work-order history, with dates and costs attached. The only question is whether anyone has run the report, and read it properly.

Everything else in a reliability programme is an argument about the future.
Bad actors are not. They have already happened. They are sitting in your work-order history right now, with dates and costs against them, and the only question is whether anyone has run the report — then whether anyone has read it properly, which is the harder half.
In the 1940s the quality engineer Joseph Juran went looking for a name for a pattern he kept finding in defect data: a small fraction of causes producing most of the loss. He borrowed it from Vilfredo Pareto’s observation about wealth concentration, coined the Pareto principle, and handed management its most durable heuristic — the vital few and the trivial many, a phrase he later amended, carefully, to the vital few and the useful many (Quality Control Handbook, 1st ed. 1951).
Maintenance data tends to obey Juran with almost embarrassing fidelity. In most plants that run the report, a handful of assets turns out to own a disproportionate share of the cost, the downtime and the 2 a.m. callouts. Whether yours do is a question your own report answers, and a flat distribution would be worth knowing too.
Three reports, and the traps between them
The core report is trivial: work orders per asset, cost per asset, downtime per asset, twelve months, sorted descending. On a plant with a working asset hierarchy it is one query. The traps are not trivial at all.
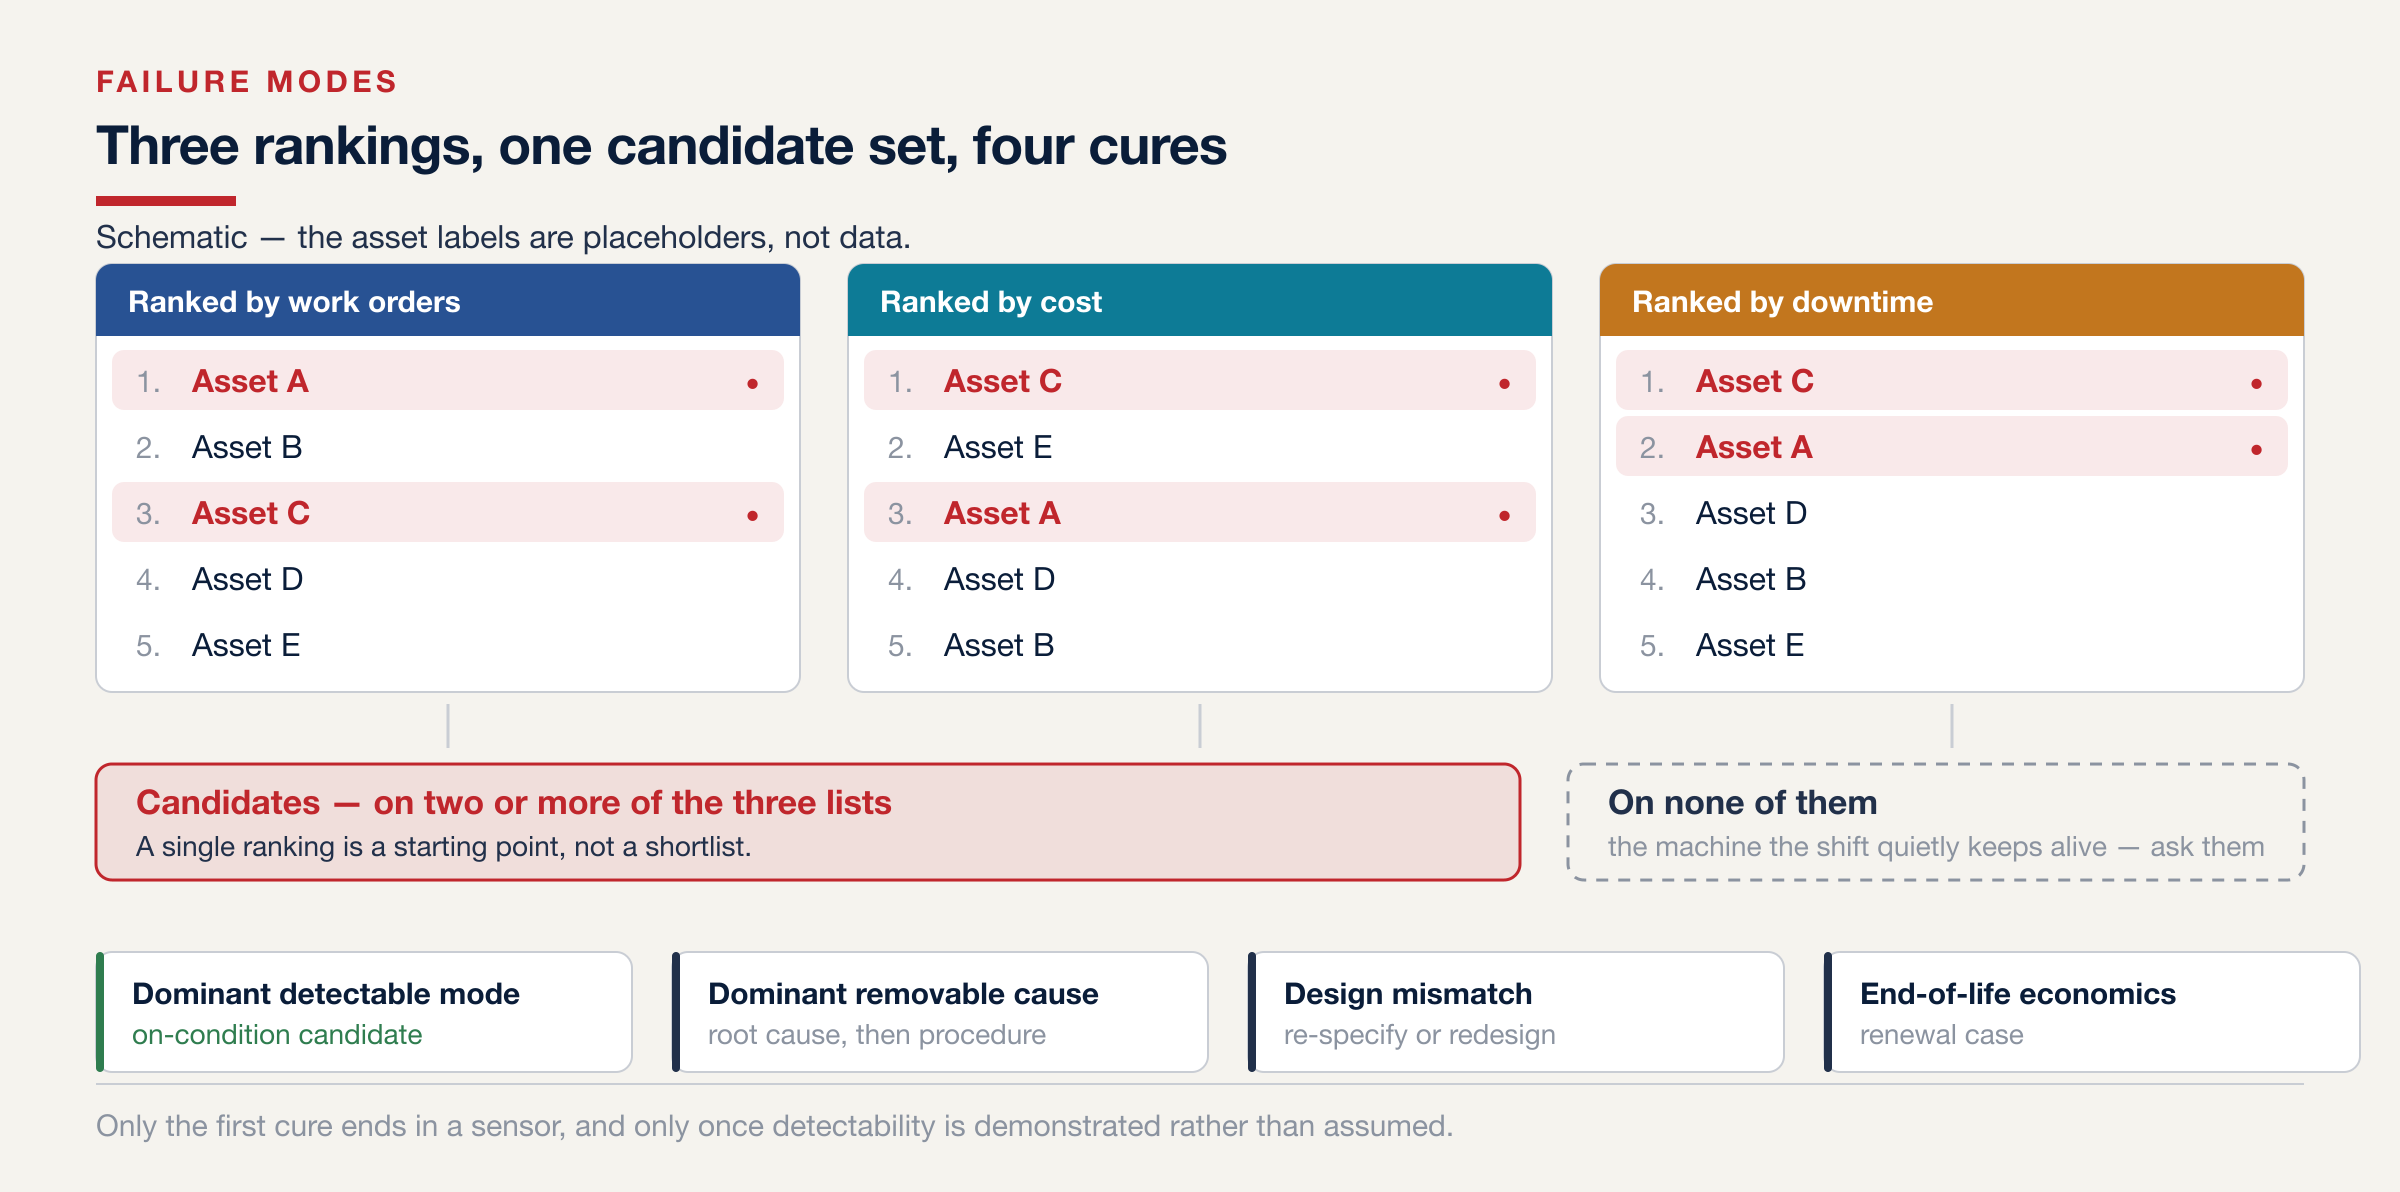
Rank by more than count. Frequency, cost and downtime produce different top-tens, and the difference is diagnostic rather than annoying. A small monthly nuisance and a rare expensive event are different diseases with different cures. Run all three, put the rankings side by side once, and treat the assets appearing on two or more lists as the real candidates.
Normalise by population. Forty identical conveyor rollers producing forty work orders is a class problem — design, specification, environment — not forty bad actors. The unnormalised ranking quietly rewards whichever component the plant owns most of.
Distrust the coding. “General repair” and free-text work orders both hide actors and invent them. Until the maintenance history has been cleaned properly, the cure is cruder and more effective than any query: read a sample of the actual work-order text before believing any ranking that came out of it.
The actor with no work orders
The fourth trap is the one the query cannot help with.
Somewhere on your plant is an asset with a suspiciously clean record, because operations nurses it. A manual reset three times a shift. A workaround written into nobody’s procedure. Everyone knows to tap the sensor. None of that work raises an order, so none of it reaches the report, and the machine looks well behaved right up until the person who knows the trick retires.
That work is real and it is expensive, and the only instrument that finds it is a conversation. Ask the shift leads what they babysit. Ask the night shift, specifically, because the night shift is where the workaround gets invented and where nobody is watching it get normalised. Two sentences from that conversation routinely outrank a query.
Four diagnoses, four cures
A bad actor is a symptom cluster, not a diagnosis. Rewriting its failures in the mode, mechanism and cause grammar usually lands it in one of four situations.
| Diagnosis | Signature in the data | Cure it points to |
|---|---|---|
| One dominant mode, plausibly detectable | the same mode recurring; a mechanism with a progression somebody could measure | an on-condition candidate — once detectability is demonstrated rather than assumed |
| One dominant cause, removable | mode varies, cause constant: misalignment, contamination, operating error | root cause analysis into precision practice or procedure; no sensor required |
| Design mismatch | failures since commissioning; duty exceeds specification | redesign or re-specification — stop paying maintenance for an engineering debt |
| End-of-life economics | rising frequency across many modes | a renewal case, funded by the actor’s own documented cost |
The first row is where bad-actor work and a predictive programme merge. An actor with a dominant, plausibly detectable mode arrives with its baseline already written, because the twelve-month ranking is the “before” that any later value argument will need. The second row is humbling and common: a great many repeat failures trace back to installation and operating causes, where a procedure change fixes what a sensor would only have watched. How large that share is in your plant is exactly what the diagnosis column is for.
At Meridian — an illustrative composite plant, not a client — the three rankings converge on an unglamorous shortlist. The labeller, the plant’s folklore favourite, turns out to have an operating cause sitting in the product-changeover procedure, cured for the price of a laminated checklist and an hour of operator training. Conveyor gearbox GB-7 shows one dominant, plausibly detectable mode and goes forward as a monitoring candidate with its own ranking history as its baseline. And a dosing pump’s actor status dissolves under normalisation: it is one of six identical units, the only one on the abrasive duty, so it is a class and specification problem, re-specced at the next rebuild.
Three actors, three different cures, one sensor among them.
A fault detected is not a fault understood
When Taiichi Ohno built the Toyota Production System he armed its supervisors with a tool of almost insulting simplicity: ask why five times. His own canonical example was a maintenance failure. A machine stopped by a blown fuse. Why? Overload. Why? Insufficient bearing lubrication. Why? The lube pump was not pumping. Why? Its shaft was worn. Why? No strainer — machining swarf had got in (Toyota Production System, 1988).
Stop at the first why and you change a fuse this week and next week. Reach the fifth and you fit a strainer once. The predictive lesson is direct: a monitoring programme without root-cause discipline becomes a very sophisticated fuse-changing service, predicting the same bearing failure, beautifully, forever.
Size the rigour to the consequence. A few written whys from the technician who did the job, captured at the work-order close, for corrective work on the consequence bands your site decided to care about. A facilitated session with a timeline and the evidence on the wall for a repeat mode or a costly surprise. The full formal treatment for a safety or environmental event. What counts as “costly” is not a number this article can hand you — it comes from your own consequence scales, one local calibration, reused.
Three habits separate that from blame with paperwork. Causes are conditions, not people: “operator error” is where analysis stops thinking, and the honest question is what made the error easy. Evidence before hypothesis: preserve the failed part, photograph the as-found state, pull the trend before the teardown erases the scene. And every link is verifiable — each “because” carries either evidence or an action to go and find it, because a chain of unverified becauses produces confident wrong fixes faster than a plant can absorb them.
At Meridian (illustrative), the loop’s first cycle runs on GB-7. The whys on its latest bearing job reach a breather left off after the last overhaul, letting washdown water into the oil: cause, a procedure gap; mechanism, water-accelerated fatigue. The fixes cost a breather, a checklist line and an edit to the failure-mode worksheet. The monitoring question stays open — now aimed at a mechanism whose main cause the plant has actually removed.
The exercise: twelve months, three rankings, one conversation
An afternoon, no capital, and nothing you do not already own.
- Pull twelve months of work-order history and rank it three ways: orders per asset, cost per asset, downtime per asset.
- Mark the assets that appear on two or more of the three lists. That is the candidate set — the single ranking is not.
- Normalise: for each candidate, count how many identical units the plant runs and how many of them appear. One of six is a specification question, not an asset question.
- Read the raw text of ten work orders from the top candidate before believing anything the ranking says about it.
- Ask two shift leads, separately, which machine they quietly keep alive. Write down whatever they name.
- Write one diagnosis — mode, mechanism, cause — for one candidate, and name which of the four cures it points to.
Here is what will probably happen. The three lists will disagree more than you expect, and the disagreement will be the most useful thing on the page. At least one name will turn out to be a class problem wearing an individual asset’s identity. And at least one machine the night shift names will not appear on any of the three lists at all.
That last gap is not a failure of the report. It is the measurement of what your records do not record — which is the same gap every later link in the chain has to live with.
Which machine does your night shift quietly keep alive — and is it anywhere on the report?
The three-ranking method and its traps, the four-cure diagnosis grammar, and the tiered root-cause discipline are from Predictive Maintenance: Practitioner Reference Frameworks and Planning Guide (Part 3: Failure Modes, Reliability, and Degradation).
Lokesh Chennuru writes Industry Digits field notes for industrial decision makers, focused on automation, IIoT, condition monitoring, predictive maintenance, and industrial AI.
Connect on LinkedInQuestions industrial leaders ask about this
What is a bad actor in maintenance?
An asset that consumes a disproportionate share of maintenance cost, downtime or callouts relative to the rest of the plant, identified from work-order history rather than predicted. Unlike almost everything else in a reliability programme, a bad actor is a backward-looking finding: the events have already happened and are already recorded.
How do you find bad actors in a CMMS?
Run three rankings over twelve months of work-order history — work orders per asset, cost per asset, downtime per asset — and treat the assets that appear on two or more of the three as the real candidates. Frequency, cost and downtime produce different top-tens, because a small monthly nuisance and a rare expensive event are different diseases.
Why normalise a bad-actor ranking by population?
Because forty identical conveyor rollers producing forty work orders is a class problem — design, specification or environment — not forty bad actors. Without normalisation the ranking rewards whichever component the plant simply owns the most of, and the resulting fix gets aimed at an individual machine when the cause sits in the specification.
Does every bad actor need a sensor?
No. Rewriting an actor's failures in mode, mechanism and cause form usually points to one of four situations: a dominant and plausibly detectable mode, which is an on-condition candidate once detectability is demonstrated rather than assumed; a dominant removable cause, cured by procedure or precision practice; a design mismatch, cured by re-specification; or end-of-life economics, which is a renewal argument.
What does a flat bad-actor distribution mean?
That the loss is spread across a population rather than concentrated in a few machines, which is a legitimate and useful finding. It says the cheapest next move is probably not aimed at an individual asset. Whether any given plant's data concentrates is a local question its own report answers; it is not something that can be assumed in advance.
Predictive Maintenance — Practitioner Reference Frameworks and Planning Guide
The twelve-part reference this series draws on: foundations and the value case, asset criticality and strategy, failure modes and degradation, the monitoring technologies, asset-class playbooks, sensors and IIoT architecture, data foundations, signal processing, analytics and prediction models, alerts and diagnosis, work management and CMMS integration, and pilot execution through rollout and governance — 126 sections with 46 technical figures.